|
|
|
Anatomy of a Performance Event (4/2/2010)
|
Introduction
Since the fall of 2009, when I began testing porous deturbulator membranes, I have noticed occasions when flying near the 52 knot (kt)
performance peak (Fig. 4), the glider would pitch down dramatically and hold the new attitude for some time afterward,
all while holding the speed constant. This happened enough times in smooth air that it became obvious I was witnessing the result
of increased wing lift that lasted for perhaps half a minute. So, I began flying with a camcorder to capture
these events. This article documents such an occasion. It adds to the mountain of evidence that modified boundary flow through deturbulation
does indeed occur and is capable of doubling the performance of a glider.
Overview
After taking sink rate measurements on 4/2/2010, while cruising home, I decided to try 52 knots (indicated) a third time.
I was cruising at 60 knots (kts, nautical miles per hour, about 15% faster than mph) and began slowing down. The glider gained altitude
normally as it pitched up, then, at 52 kts, the nose pitched down sharply, indicating a performance boost. I tried to hold 52 kts steady,
which proved difficult, but I was able to hold the speed close enough to produce a 100% performance boost for 30 seconds.
At the onset of this performance scenario the nose pitched down sharply and the sink rate declined from 4.5 to 1.7 kts.
These indications of improved performance were documented by log data (altitude vs. time) and
by a video recording that captured the airspeed indicator (ASI), the variometer and the horizon.
These events are evident from log data depicted in Figs. 1 and 2 and can be viewed in Video 1 below.

Figure 1. Pressure (red) and GPS (blue) altitude points vs. time (1 sec intervals)
(click to enlarge)
Figure 2. Flight path in 3D reconstructed from log data
Aerodynamics Primer
This article assumes no knowledge of aircraft aerodynamics, so this primer is offered to help.
Figure 3. Lift Force goes as angle-of-attack
(from NASA Tutorial)
|
A wing creates lift by reflecting the vertical momentum of the approaching relative air flow to leave the wing with a downward change. That is, wings reverse the vertical component of the incoming flow. This is possible only by exerting a downward force on the flow stream. And, so the wing itself experiences an equal and opposite lift force that we call lift.
At any given airspeed, the lift varies with the angle-of-attack (AOA). The AOA is the angle between the approaching flow and the chord line (leading to trailing edge). The greater the AOA, the greater the lift and vice versa. Likewise, at constant AOA, the lift varies with airspeed. The greater the airspeed, the greater the lift force and vice versa.
This is known to everyone who has ever stuck a flattened hand out a car window into the air stream. Tilting the hand up increases the lift on the hand. Tilting it down reverses the direction of the lift. Likewise, the faster the car travels, the greater the lift and vice versa. These concepts are illustrated in Fig. 3.
Steady-State Flight
When an aircraft is flying level at constant airspeed in stationary air, the downward directed weight of the aircraft is precisely balanced by the upwardly
directed lift force. As long as these forces remain equal, the the net vertical force will be zero and the aircraft will not accelerate up or down.
That does not mean the the aircraft is not moving veertically. It only means that the vertical motion is constant.
For, instance, a glider flying at constant airspeed in a stationary air mass descends at a rate that is proportional
to the aft directed aerodynamic drag force.
The elevator is the AOA control for an aircraft. If the pilot pulls back slightly on the control stick and holds the new position, the AOA increases and the lift force increases with it. That, in turn, produces an unbalanced, upward force on the aircraft, causing it to accelerate upward. This upward acceleration may cause the aircraft to begin moving to a higher altitude or it may only reduce begin reducing the rate of descent (sink). For sake of discussion, let's assume the aircraft begins movint to a higher altitude. As the aircraft ascends, it's gravitatinal potential energy increases.
The equation for a change in gravitational potential energy is Ep = mgh, where m is the mass (or weight) of the aircraaft, g (9.8m/s2) is the gravitational constant and h is the change in altitude.
Ignoring the energy loss from aerodynamic drag, the increased potential energy must produce a corresponding decrease in the kinetic energy, the energy of motion. This is because physics demands the conservation of energy. Energy cannot be created or destroyed. So, the total energy (potential plus kinetic) must remain constant.
The equation for kinetic energy is Ek = (1/2)mv2, where m is the mass (or weight) and v is the magnitude of the velocity of the aircraaft.
Thus, as the aircraft rises it slows to a new equilibrium airspeed that is appropriate for greater AOA. As the aircraft slows down, the lift declines accordingly and eventually reaches the weight of the aircraft again. After that, the aircraft flies at a reduced, steady speed.
The reverse occurs when the control stick is moved forward.
The thing to remember is that when the aircraft slows down the AOA increases (nose up) and when it speeds up the AOA decreases (nose down). However, changes 1 and 3, noted above (increased altitude and downward pitch), violate normal behavior! It follows that this performance scenario indicates a change in wing aerodynamics that reverses the normal relationship between AOA, airspeed and altitude.
Instrument Panel
Airspeed Indicator
The ASI is locate top center in the panel.
The critical speed points marked on the ASI face are 50, 52 and 60 kts. 50 kts is at the 3 o'clock position.
52 kts is marked by a blue hash mark (enlarge the video to see this mark).
60 kts is the next speed that is labeled.
Variometer
The variometer is below the ASI.
The variometer indicates the rate of vertical motion in kts. Zero is at 9 o'clock.
Hash marks above zero indicate positive altitude gain rates
(loosly called lift).
Hash marks below zero are for negative altitude gain rates (loosly called sink).
Hash marks are spaced 1 kt apart. The 12 o'clock mark indicates 5 kts of lift
and the 6 o'clock mark indicates 5 kts of sink.
Onset Events
Now, play Video 1. Replay it as necessary to verify the timings of the events recorded.
You may have to enlarge it to read the airspeed indicator (ASI) and variometer.
The clip shows the onset of the performance scenario.
First, notice that the airspeed is initially 60 kts and the sink rate is 4.5 kts, about 450 feet per minute (fpm).
Also, watch the ground features outside the canopy. It was a hazy day, but the ground features are plain enough.
Pitching motions are clearly evidenced by up and down movements of the ground features with respect to the glider.
Video 1. Onset of Performance Scenario
As you play the video, you will see the ASI needle move steadily from 60 kts to 52 kts (large blue hash mark below 3 o'clock position). As the glider slowed down the nose slowly pitch up and the glider gained 29 feet as kinetic energy converted into gravitational potential energy. This is normal. However, precisely at 52 kts the glider departed from normal behavior when the nose suddenly pitched sharply down. It did this while the airspeed was held virtually constant. Watch the ASI as the nose pitches down and holds the new attitude. As this continues, the variometer needle begins moving up from 4.5 to 1.7 kts. These actions violate the theory! The nose should have stopped rising at 52 kts and ahould have remained at that new angle as the airspeed held constant. Clearly, something changed suddenly to make the glider fly the same airspeed with a sharply reduced AOA.
Analysis
To understand what happened, see Fig. 4. These
glide ratio measurements
were taken previously in the same flight.
The black trace shows baseline performance of the glider.
The red trace shows the glide ratios with
PETEX deturbulators on the wings.
Figure 4. Glide Ratio vs. Airspeed
As the airspeed slowed from 60 kts, the nose pitched up gently and the glilder climbed normally. But when the speed reached 52 kts, the deturbulators suddenly began working; i.e., a beneficial flow-surface interaction mode turned on and the boundary flow over the wind snapped to a modified state. I'll not say more about the modified flow state except that it attempted to increase the lift force. But, as the video shows, holding the airspeed constant at 52 kts caused the lift force to remain equal to the glider's weight, thereby causing a reduction in the AOA. Finally, in keeping with theory, the pitch remained at the new attitude as the airspeed remained constant.
Finally, as the glider held the new AOA, the sink rate decreased from 4.5 kts to 1.7 kts. This extreme performance boost is clearly due to the preceding event the suddenly occurred at the well documented performance airspeed of 52 kts. This occurred at 3700 feet, about 1000 feet above the atmospheric boundary layer where vertical mixing occurs. This can be verified by the steadiness of ground features relative to the airframe in the video clip. It follows that the event recorded is not due to a sudden encounter with rising air.
This sequence of occurrences is corroborated by Fig. 4. The arrow labeled Start shows how decreasing the airspeed from 60 to 52 kts moved the glider from a region of poor performance to a sharp peak of extremely good performance. The sudden performance boost at the precise moment of reaching this measured performance airspeed is not a coincidence. It is in fact a recurrence of the measured phenomenon.
Corroboration
Preliminary modeling of the deturbulator skin is being done by Jari Hyvärinen using his
LINFLOW software. Fig. 4a below shows a mode with large
very displacement amplitudes that should occur around 52 KIAS. This mode has been seen
popping up at 52 KIAS in flight and is presented here in Fig. 4b. It appears that this mode is responsible for
initiating this performance event.
Figure 4a. Model of Deturbulator Panel Mode at 52 KIAS
|
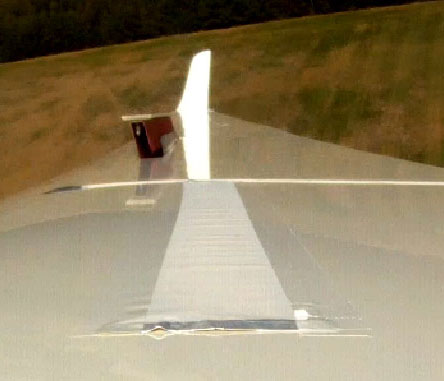
Figure 4b. Photograph of Deturbulator Panel Mode at 52 KIAS
|
Bobble Event
Video 2 captures a bobble in performance while holding the glider at the 52 kt performance airspeed.
The effect on the flight path can be seen in Figs. 1 and 2 and above Video 2.
The clip shows that, while holding 52 kts, suddenly the nose pitched up, indicating a loss of lift.
The suddeness of the upward pitching motion indicates the sudeness of the loss of lift.
Clearly, the beneficial, deturbulated, boundry flow snapped to another pattern, possibly
the conventional pattern with a transition bubble and reattachment point ahead of the deturbulator panels.
The upward pitch momentum carried the attitude beyond the new equilibrium point and the glider began losing airspeed. This was corrected by the pilot and the nose again pitched down as the glider again reached the 52 kt performance peak. This was a second onset of performance. The arrows labeled Bobble in Fig. 4 show the speed changes as they relate to expected performance.
This episode illustrates the instability of the flow-surface (deturbulator surface) interaction mode(s) that enable(s) flow patterns favorable to extreme performance.
Video 2. Bobble Event
Termination Events
The termination of the performance scenario is illustrated in Fig. 4 by a pair of arrows labeled End.
It started when I allowed the glider to slow down past the 49 kt performance notch seen in Fig. 4.
The nose gradually pitched up with the slowing airspeed and loss of deturbulator performance.
Then, upon reaching the 48 kt performance peak, the glider began pitching down again, slowly at first then very quickly.
The downward pitch momentum carried the glider past the equilibrium point and the airspeed built up quickly, taking the glider back across the 49 kt
performance notch and beyond the 52 kt peak to 60 kts where performance suffers. This ended the episode.
Video 3. Termination of Performance Scenario
The suddeness and great momentum of the down pitch at 48 kts can be understood by noticing the extreme performance difference over an airspeed span of just 1 kt (48 to 49 kts) in Fig. 4.
Entire Scenario
Play Video 4 to view the entire scenario without interruption.
Video 4. Entire Performance Scenario
The Numbers
Figs. 1 and 2, show that the glide angle before the onset of extreme performance was steeper than that of the performance plateau.
The measured glide ratios are 13:1 and 30:1 respectively. Thus, the performance jumped 130%.
However, both ratios are below the baseline performance of the glider.
This could support the claim that the this event was not a case of extreme performance at all, but rather a temporary loss of extreme drag.
I will address this under Objections below.
Instead, I take the view that these low glide ratios are the result of flying in a subsiding air mass, perhaps on the down side of a long
shear wave.
Figure 5. Flight Profile Showing Performance Event
(click to enlarge)
This possibility appears to be supported by the overall performance, while cruising, after this performance event (Fig. 5). This pattern is shown in Fig. 6. The brown curve shows the glide ratios while cruising. The brown horizontal line is the baseline performance of the glider while flying 65 kts, an estimate of the averge cruising speed. The airspeeds are also labeled. The altitude vs. time profile is plotted in the background (red=pressure altitude, blue=GPS altitude). Regions highlighted in yellow show the data points that were used to calculate the performance peaks.

Figure 6. Flight Cruising Performance
The glide ratio calculations assume a constant speed of 65 kts, which is not accurate,
but is close enough for the general features of the performance curve to be acceptable.
(click to enlarge)
Notice that the performance valleys are at first rising and then take a downward slope. This suggests a long shear wave influencing the data taken while cruising at lower altitudes near the boundary layer.
Objections
Experienced aerodynamicists can hardly observe evidence like this without raising the usual objections.
There is a tendancy to voice them without considering all of the evidence documenting deturbulator boundary-flow control.
I will not cite the evidence here. The progress articles
on this website should suffice.
The most obvious objection is that the glider encounteres rising air (convection) when performance speeds are being measured. The problem with that is the amazing correspondence of this "rising air" with performance measurements. It has been well documented that the "rising air" repeatedly arives at the beginning of performance measurements and leaves precisely at the end of them.
Furthermore, this performance scenario occurred at 3700 ft altitude which was about 1000 ft above the top of the boundary layer (where thermal mixing occurrs). The top of the boundary layer was observed on tow as all turbulence ceased at 2700 feet. Furthermore, one can see the stable motion of the airframe in the videos. "Kick in the seat of the pants" events do not normally occur in the smooth air above the inversion level. Shear waves my occur, as well as small scale turbulence, but not vertical convection that can kick a glider around as in this event. It is not reasonable to assume that this scenario was produced in smooth air, above the inversin level, by convection that just happened to arrive at precise moments when previously measured performance airspeeds were encountered.
A second objection might be that this event was not a case of extreme performance at all, but rather a momentary loss of extreme drag. Based on the enhanced performance measurements (Fig. 4) taken in the same flight at higher altitudes (Fig. 5), with the 52 kt point being measured twice, and also numerous prior measurements that corroborate them, I think that the low glide ratios of this event resulted from flying in the down side of a long shear wave.
Summary
The video clips of this event, together with log data from the flight and performance measurements taken in the same
flight make a convincing case that deturbulator boundary flow control is indeed capable of producing extreme performance improvements.
The event documented here lasted only 30 seconds, due to my failure to recover from a sudden loss and restoration of extreme performance,
but prior measurements (Fig. 7) show that periods of 1.2 minutes repeat consistently.
Figure 7. Repeated Instances of Extreme Performance Lasting 1.2 Minutes
(click to enlarge)
This event is yet another piece of evidence supporting the reality of extreme performance from deturbulated boundary flow control. It's time for professioinal aerodynamicists to take this seriously and to initiate their own investigations. To date, I am aware of two who have made this commitment. Dr. Sinha and I stand ready to assist any legitimate investigation.
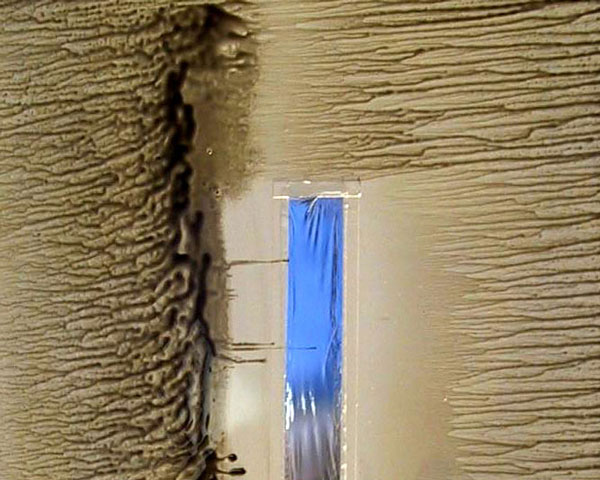
Figure 8. Oil-flow Visualization of a Deturbulator Panel on the Pressure Side
(click to enlarge)
If you are interested, I suggest that you contact me for samples of deturbulator substrates. These are the only components that are not commerically available. Also, I suggest that you begin with bottom surface tests. Top surface deturbulation is very difficult to simulate in wind tunnels. Instead, try a panel on the pressure side of the wing just behind the reattachment point as illustrated in Fig. 8. No vent ports are needed and you should see consistent drag reductions.
| © Copyright 2003-2012 Jim Hendrix | Disclaimer |