|
|
Since this report was written, it has been learned that a rear-facing step on the lower surface only produces a
modest, but practical, improvement of around 15%. For more about this, read
A Practical Modification. This may be of more interest to glider owners
than the present report which describes rear-facing steps on both surfaces, that produce larger improvements, but polars
that are not practical fly normal soaring.
For a full report of the concept of rear-facing steps near the leading edge, including an overview of the concept,
test data and a simple explanation of how it works, read
The Deturbulator Tape (PDF).
For more information on prior Deturbulator tape experiments, see
Leading-Edge-Tape-Only Performance Measurements.
|
Background
An important part of deturbulator installations is a thin tape applied to the leading edge of the wing
to present a small (70 um) rear-facing step that "preconditions" the flow for the deturbulator panels.
Performance measurements with the leading-edge tape alone (no deturbulator panels) have shown significant
performance enhancements at some airspeeds.
This is a startling discovery, as it opens the door to easily achieving worthwhile performance enhancements.
Little effort or expense is required to install the tapes, so anyone can test their effects!
Considering the large fleet of Wortmann airfoil gliders in operation, this discovery opens the door
for many other owners to participate in The Deturbulator Project.
Compared to deturbulator panels, the leading edge (deturbulator) tape is a simple, passive, robust modification that
avoids the dynamic instabilities of top-surface deturbulator panels, to date.
On the down side, there is a very narrow performance notch near 50 KIAS, depending on wing loading. (See Figure 2 below.)
In the past, I was hesitant to reveal enough information for the general public to do their own
deturbulator installations. The reason was that it would invite a cacophony of voices making all sorts of conflicting claims.
Acquiring good performance measurements requires skills that pilots do not normally practice, so initial
test results are often useless. Unless you are willing to persist in taking good data in acceptable weather conditions,
you will either give up or you will unknowingly report poor quality results.
However, the project has been moving very slowly, taking measurements with one glider, so I have decided to give the open project
concept a try. I have in mind using this website as a clearing house for your measurements and anecdotal observations.
Everything you need to know is provided below and in the links at the top of this page.
If this is something you would like to do, then I would like to hear from you today.
Candidate Aircraft
Until June 2011, deturbulator experiments have been performed only on my Standard Cirrus glider. It is certain that
the results are critically dependent on its
Wortmann airfoils.
Wind tunnel simulations
show that the top surface transition bubble remains fixed for airspeeds between 55 and 80 kts.
This plays an important role in the results I have been reporting.
Other airfoils may be expected to yield results that differ greatly.
However, it is reasonable to expect good results with Wortmann and similar airfoils.
Also, it should be noted that deturbulation cannot be expected to work
on wings are not smooth and precisely formed, like glider wings.
The Incomplete Guide to Airfoil Usage
is a good website for checking your airfoils.
Expected Performance
In May 2010, I began soaring with the deturbulator panels removed and the leading edge tapes in place.
An opportunity to demonstrate a performance benefit occurred on 5/27/2010 when an out-and-return
cruise of 20 nm (37 km) in smooth air under overcast skies yielded about 25% overall improved performance.
I knew that something good
was happening on the return leg. When I turned for the trip home, the glide computer indicated 731 feet
below glide slope to arrive 1000 feet above ground level (agl); i.e., I expected to land out.
However, without interruption, the glider gained steadily on the glide slope so that I arrived 917 feet agl.
Figure 1 shows the glide path. Since then, the glider has performed similarly on long glides in smooth air.
Figure 1. Flight Path of an Out and Return Glide
Although conditions in the summer months are not suitable for sink-rate measurements, on 6/19/2010
I towed to 6000 feet agl in the early morning smooth air and took measurements for speeds between 40 and 70 kts.
High clouds were blocking the morning sun. After the flight the clouds smoothed out and formed
into an east/west line that moved south, indicating a weather front. Sure enough, the high speed points indicated
rising convection. However, the points around 49 kts repeated the familiar notch pattern. Figure 2 shows the points
from 40 to 55 kts. Next winter I plan to take better measurements, but for now even this poor quality data
seems to confirm that the leading edge tapes alone account for much of the performance I have been measuring.
Figure 2. Leading-Edge-Tape-Only Sink-Rate Measurements
Strange Polars
You can expect that a wing will behave strangely when modified in this way.
There is good news and bad news. In the future, I expect wings to be designed specifically for
a rear-facing step in order to reduce undesirable effects. Or if they cannot be engineered out,
than it will be considered worth while to endure them in order to gain advantages at specific airspeeds. Figure 3 below illustrates
my best estimate of the kind of performance polar you might expect with this modification on both surfaces.
Figure 3. Estimated Performance with Leading Edge Tapes
The red curve is a hybrid of poor quality measurements and calculations based on cruising performance.
It should not be taken as a prediction of the performance you will actually experience. I plan to improve Figure 3 in the future with
more measurements better quality. But, for now, it is my best estimate.
The orange curve is included because it may suggest the kind performance that better measurements will show.
The orange data were taken with PETEX deturbulators that had rear-facing step ventilators on the leading (low pressure)
edge of the panels. It appears that those vents sucked the membranes down to the point that they did not interact properly
with the boundary flow, and so affected the reattaching flow much like the bare wing surface.
Obviously, flying with such a strange performance polar changes the speeds you will fly while thermalling and cruising.
MacCready theory goes out the window. My experience has been that when flying near the performance notch, the glider
seeks the minimum-performance speed and must be forced away from it.
Conversely, the glider wants to move away from the performance peak on the high side of the notch, but can be held there without much
difficulty. The last two points show a 25% improvement that I have repeatedly experienced while cruising in smooth air.
The question marks in Figure 3 indicate that I am not sure what to expect at normal thermalling speeds.
This is because my only measurement (Figure 2) shows a major performance loss, but experience does not seem to concur.
In a recent competition, I regularly out climbed and achieved higher altitudes than all other gliders of any type.
So, I doubt that the large performance loss around 45 kts in Figure 2 is real.
When cruising, I normally test various airspeeds until I find the best one.
I do this by displaying the differential altitude. The differential altitude is the
hight above or below the calculated glide slope. When I find the speed that gains on the glide slope at the greatest rate, then
I hold it for the remainder of the glide. Normally, the result is a speed that differs greatly from the conventional
speed-to-fly theory. Thermalling, I have often seen increased climb rates by pushing the airspeed above 50 kts.
Humidity Dependency
See Humidity Dependency of Upper-Surface Leading-Edge Tape Effect
for an explanation of the amplitude differences in Figs. 2 and 3. It should also be recognized that with such a strong
airspeed dependency, sampled points that are more than 1 kt apart may miss actual peaks.
The Latest Measurements
Additional measurements have been taken with only the LE tapes installed. For these and future results
go to Leading-Edge-Tape-Only Measurements.
Critical 2D-Roughness Reynolds Number
Classic theory states that the critical 2D-Roughness Reynolds number for a rear-facing step to trip the laminar boundary
layer at powered aviation airspeeds is 100. This indicates that a step height of more than 0.00007 chord is needed to trip the flow.
For example, a back-step height of 0.0025 inch (63.5 um) can be expected to trip the flow on a wing section with a
36 inch (92 cm) chord, flying at speeds greater than gliders normally fly.
At glider speeds, greater step heights can be tolerated. Figure 3a illustrates non-tripping flow over a rear facing step.

Figure 3a. Navier-Stokes Simulation of Non-tripping Flow
Over a Rear-facing Step
The Lower-Surface Only Option
One option that may offer a small but worthwhile improvement without messing up the polar is to
apply a leading edge tape to the lower surface only. I have never tried this, so I cannot attest to the
results, but a comparison of Figures 4 and 5 below indicates that a bottom-only rear-facing step has
clear beneficial effects on the lower wing surface.
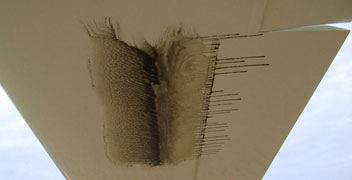
Figure 4. Normal Bottom Surface Oil-flow Pattern
|
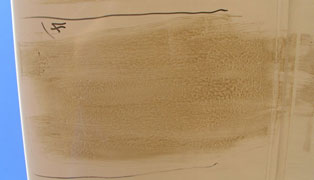
Figure 5. Deturbulated Bottom Surface Oil-flow Pattern
|
Of course, the obvious objection is that there would be an upper edge of the tape at the zero AOA stagnation point (nose of the wing)
that might trip the flow or at least affect the upper surface flow in some undesirable way.
However, considering the thinness of the tape and the steep flow/tape-edge angles,
I doubt that there will be any noticeable effects from the top edge of the tape.
This is substantiated by Figure 5a below. Notice in this image that the step is not sharp at all. Compared to Figure 3a above,
it appears that the sharpness of the step is not critical. In fact, the tapes on my wings appear to have rounded edges. They have
been installed for almost two years and have been cleaned many times with an adhesive remover solvent.
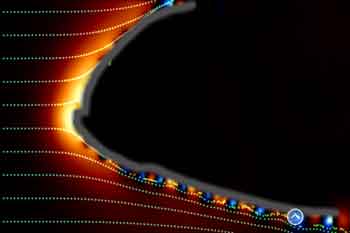
Figure 5a. Lower-Surface Only Navier-Stokes Simulation
|
Figures 4 and 5 show normal and deturbulated oil visualizations of bottom surface boundary flows.
Since there is no deturbulator on the bottom surface, it appears that the back-facing step presented by the
leading edge tape is enough to prematurely detach the flow, flatten the bubble and reattach the flow gently at a grazing angle
so as to produce less turbulence, and presumably a thinner boundary height, at the trailing edge.
Compared to the customary "turbulator" technique, which trips the flow at a point well ahead of the transition bubble,
this method has obvious advantages. Someone needs to test this option!
Installing a bottom-surface only tape will be a challenge because simply installing a half width tape will not position
the bottom surface edge at the right place. Table 1, below, gives measurements on the top surface for locating a 2 inch (5 cm) wide
tape so that the bottom edge provides the results seen in Figure 5 below and in
other oil flow images.
You will have to measure back from the bottom edge to the nose of the wing to get the tape width at any given span station.
Cutting the tape will also be a challenge.
On the other hand, since nothing is known about the effect of moving the lower surface tape edge, it is worth while
testing a simple 1 inch (2.54 cm) wide tape with the top edge located directly on the nose of the wing.
About the Tape
Although at present, there is no data on the effects of varius tape thicknesses, it is reasonable to expect
that effects are critically dependent on the thickness of the tape.
Too thin and there will be no effects.
Too thick and the edges will trip the flow (see Critical 2D-Roughness Reynolds Number above).
Between these limits, the results will vary from nil to something perhaps beyond the greatest performance changes measured to date.
To prevent tripping the flow at glider airspeeds, the tape should be no thicker than about .003" (76 um).
I use Scotch 3650 Series carton-sealing tape.
It's 48 mm wide and measures between 0.0025" (64 um) and 0.003" (76 um) thick depending on how much force I put on the calipers.
This tape adheres securely and appears to be last indefinitely. Also, bugs wipe off of it easily.
However, it will scuff, so a little care is needed to keep the leading edge smooth.
Also, when you remove this tape, a layer of adhesive will remain on the surface, requiring a
good adhesive remover, like 3M General Purpose Adhesive Cleaner (08984), to take it off.
Placement of Tapes
The placement of the tape is critical. I have measured drag differences with only a 1/4" shift up or down.
Measurements for locating the leading edge tape are made along the top surface from the trailing edge.
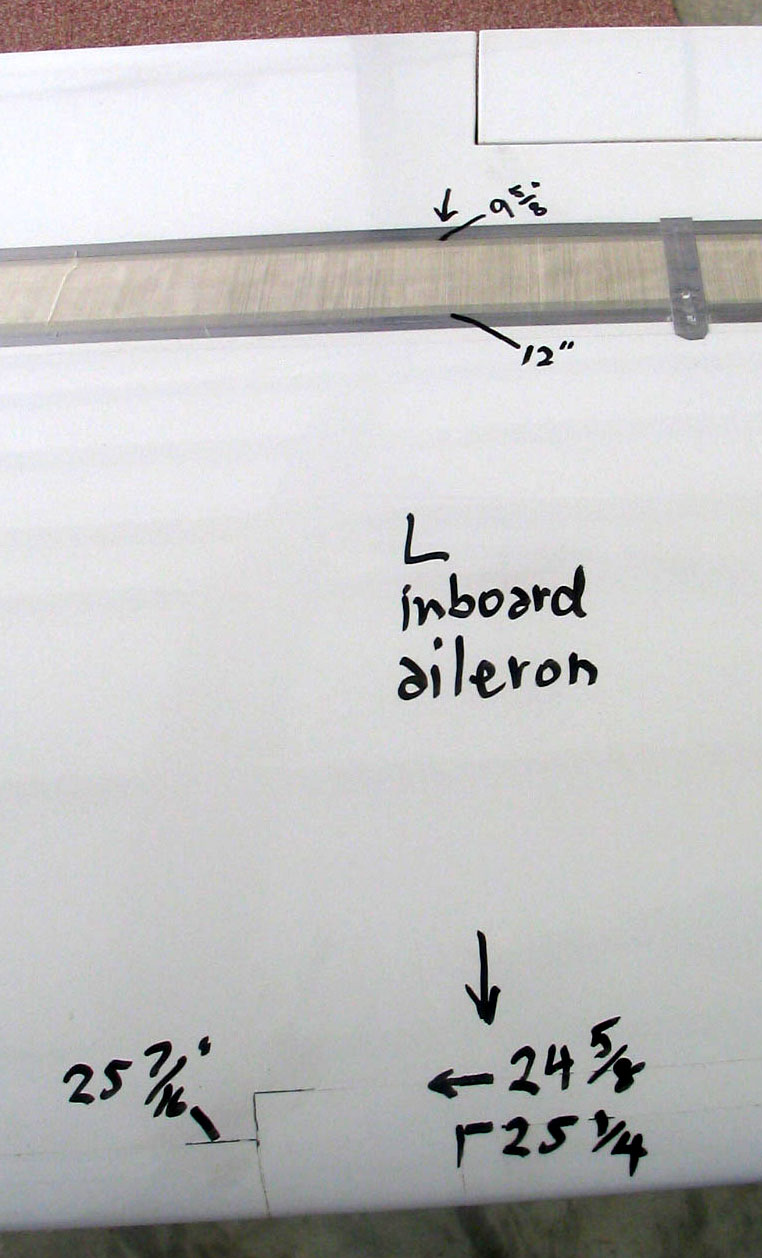
Three span stations need to be measured, (1) near the root, (2) at the inboard end of the aileron and
(3) six inches from the wing tip. From the wing root to the airleron, a single strip of 2 inch wide tape is applied.
From the inboard end of the aileron to the tip we effectively widened the tape by overlapping two strips.
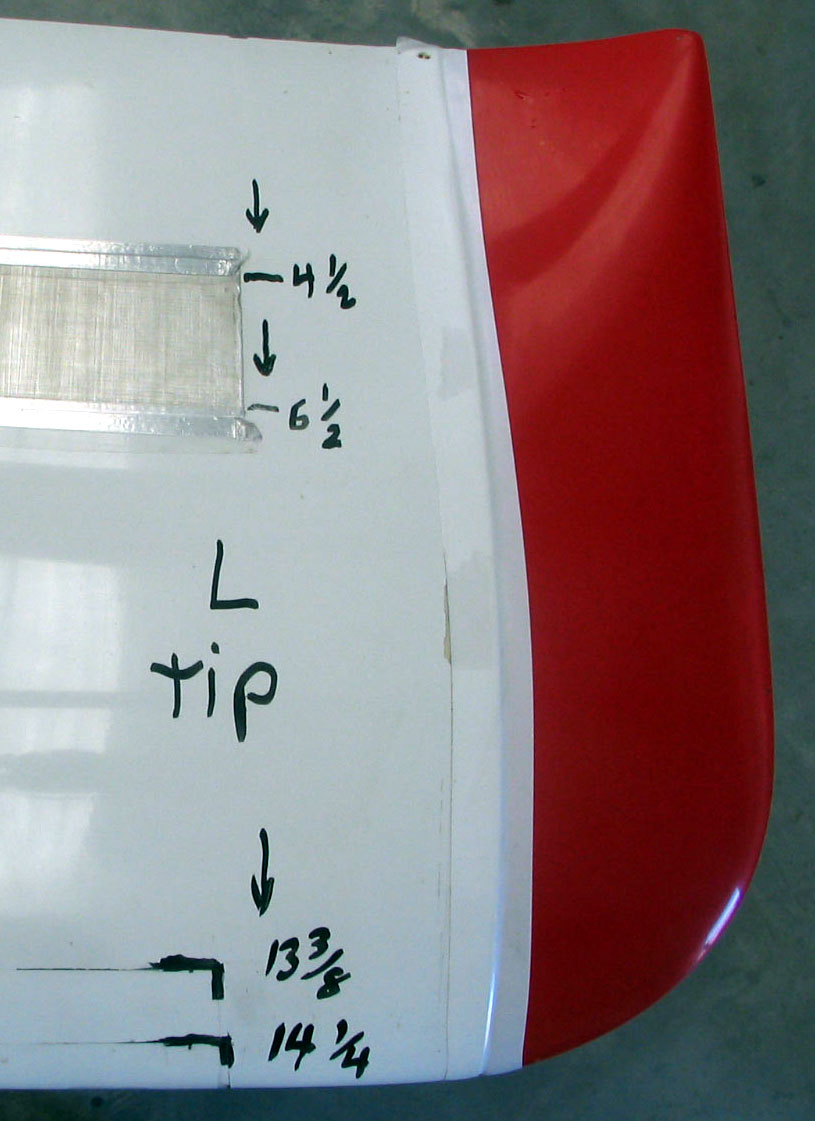
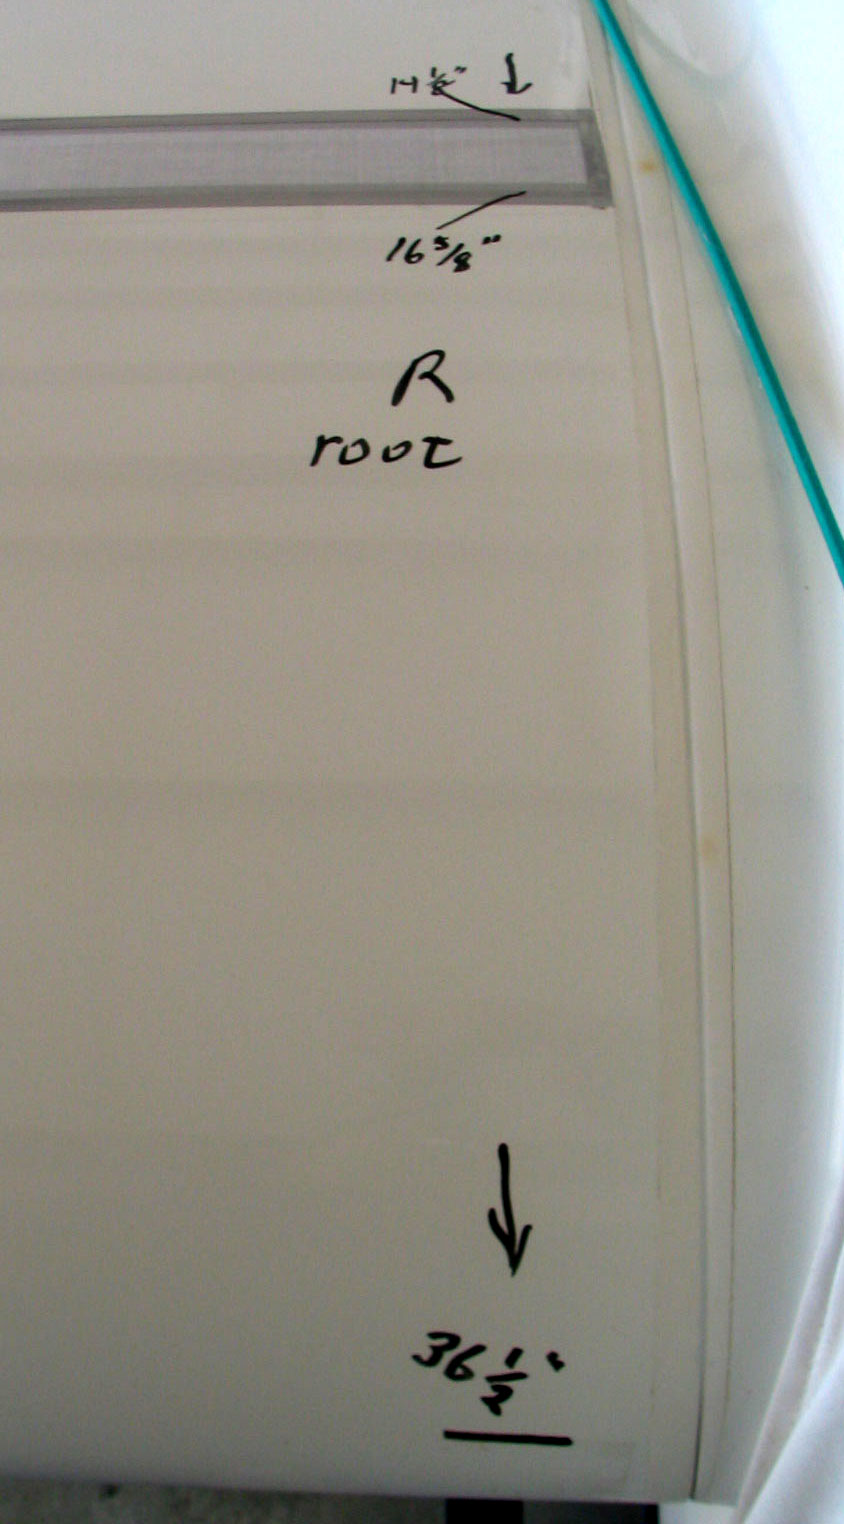
Therefore, two measurements are given. Figures 6-8 below show photographs of the measurements on the left wing
and Figures 9-11 show the right wing. There are some undesirable deviations between the wings.
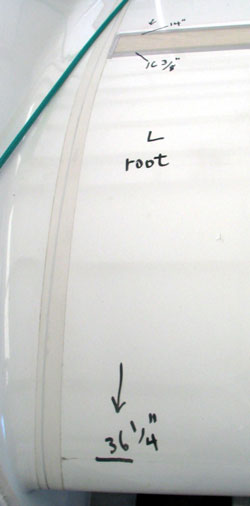
Figure 6 - Left Root |
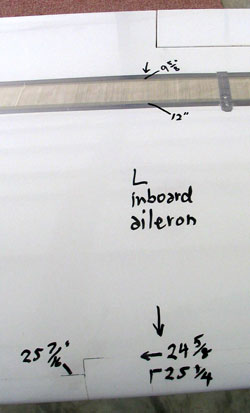
Figure 7 - Left Aileron |

Figure 8 - Left Tip |
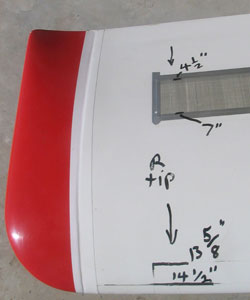
Figure 9 - Right Tip |
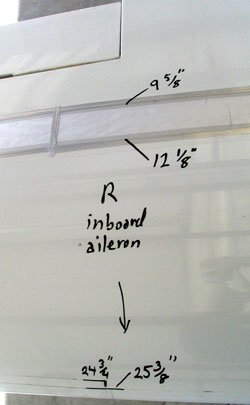
Figure 10 - Right Aileron |
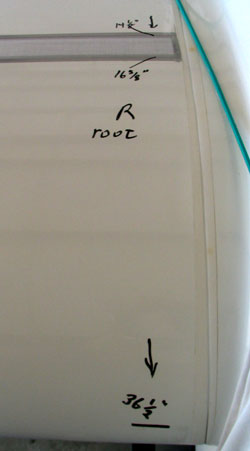
Figure 11 - Right Root |
Table 1, tabulates the measurements, averaging the differences between wings.
Table 1. Distance along the Top Surface
from the Trailing Edge to the Tape
| Span Station |
Wing
Chord |
Distance
to 1st Tape |
Distance
to 2nd Tape |
| Near Wing Root |
35.3 in
89.7 cm |
36.4 (36 3/8) in
92.4 cm |
|
Inboard End of Aileron
(inboard tape) |
24.9 in
63.3 cm |
25.6 (25 5/8) in
65.1 cm |
|
Inboard End of Aileron
(outboard tapes) |
24.9 in
63.3 cm |
24.6 (24 5/8) in
62.5 cm |
25.25 (25 1/4) in
64.1 cm |
| Near Wing Tip |
14.2 in
36.0 cm |
13.5 (13 1/2) in
34.3 cm |
14.4 (14 3/8) in
36.5 cm |
Figures 12-14 are scale drawings of the Standard Cirrus wing, at the measurement stations in Table 1.
They give a conceptual view of the effective width and placement of the tapes relative to the wing shape and chord.
If you are working with another airfoil, these images may help you decide on a placement and width of tape that might work.
They may also give an idea of the range of widths and placements that may be effective. However, it is not clear at this
time how much the various wing sections contribute to the performance changes measured to date. I have doubts especially
about how effective the outer wing panels are.
Figure 12. Placement of Leading-Edge Tape at Wing Root
Figure 13. Placement of Overlapped Leading-Edge Tapes at Inboard End of Aileron
Figure 14. Placement of Overlapped Leading-Edge Tapes at Wing Tip
Installing the Tapes
Installing long strips of tape precisely at these locations without bubbles underneath is not hard if you follow these hints.
Place the wing on saw horses with the leading edge up.
Mark the position of the tape edge on the upper surface by measuring along the wing surface from the trailing edge as indicated in Table 1.
Then stretch a line between the marks to locate positions for intermediate marks.
Add some detergent to water then wet the leading edge. (A bucket and sponge or cloth works fine. A pump-spray bottle may work better.)
The detergent breaks the surface tension, allowing the water to wet the surface.
Next apply the tape over the wet surface.
The tape will rest on the water without gripping the surface.
This will allow you to press out any bubbles and slide the tape into position.
After perhaps 12 hours or a day, the water will evaporate and the adhesive will take hold.
Performance Measurements
If you wish to take measurements, you can use your flight data recorder to automatically acquire your altitude and time data.
This will reduce your work load and eliminate human error from the data acquisition process. I have written a manual describing
the way I do it. Also, I have designed an Excel spreadsheet for
reducing and plotting your results. These are available in performance.zip.
Since you probably do not have a calibration for your airspeed system, you can plot results vs. indicated airspeeds and they will
be adequate for relative comparisons on your glider, even though they will be skewed horizontally. Comparisons to other gliders will
be inaccurate, however. If you have problems, let me know and I will be glad to help.
Reporting Results
I encourage you to submit your results to me for tabulation and presentation on this website.
Please include your IGC log file, spread sheet results, photos of your installation and comments on weather conditions, etc.
Footnote
Since this article was written, a simpler and more practical leading edge tape configuration has been devised that
appears to give 15% improvement across all airspeeds up to 85 kts on gliders Wortmann airfoils.
Learn more at 15% Cheap: A Practical Modification.
|
Jim Hendrix
|