|
|
First Sink-Rate Measurement (2/18/2005)
|

|
|
|
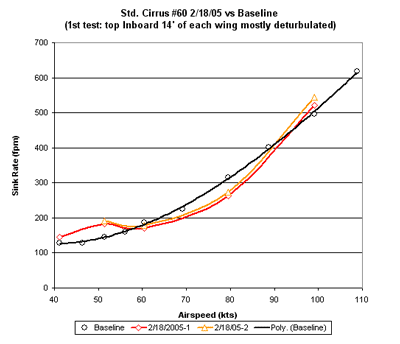
Before publishing this article the first time, I was advised against making these data public so quickly. I should have listened! Now I have to report that a spreadsheet error caused the two data series shown in Figure 25 to fall unusually close to each other. This convinced me that we had hit a golden day, with little vertical air movement aloft, making the results reliable. But, alas, that was not the case.
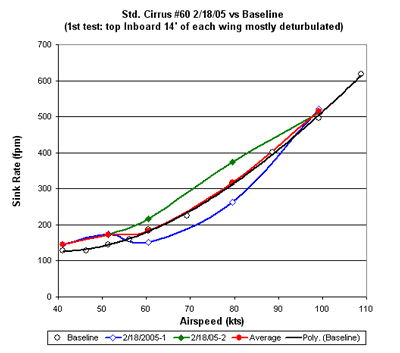
Figure 25a shows the corrected data. Here, the blue curve is the first series, taken at the highest altitudes, and the green curve is the second series taken lower down. The 40 kt point occurs only in the first (blue) data.
Following is the revised report:
On Friday, February 18, we took advantage of a break in the weather to test the effect of the first extended application of deturbulator on an aircraft. This was the first in a sequence of partial applications that will result in a full application of deturbulator on Standard Cirrus #60. For this flight, we had deturbulator on most of the inboard 14 feet of the top side of both wings (root to aileron). There was an untreated gap of about 18 inches on each wing near the outboard end, there was another at the wing root and there was no deturbulator on the bottom surfaces. Roughly, we treated 47% of the top span.
Our purpose was not to obtain a complete polar. We only wanted enough data to show if the deturbulator was working and perhaps whether it was helping or hurting performance. Because we have to drive 5 hours each time we fly, we usually manage only one flight a day. So, we decided to take data at fewer speeds and to use the altitude we save for a second set of data to indicate the scatter due to air movement.
The tow and the flight went normally, without handling problems. But, at low speeds, I found myself flying faster than I thought I should have been and it took more aft stick than usual to slow down below 50 kts. The stall speed was unchanged, between 35 and 36 kts indicated. I am flying this glider very close to maximum gross weight without water ballast.
Figure 25a is a graph of the sink rates measured on 2/18/05 vs. the baseline polar previously measured for the same aircraft.

|
|
|
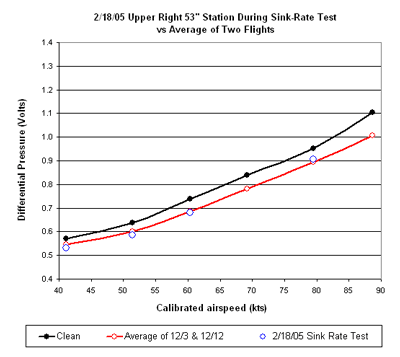
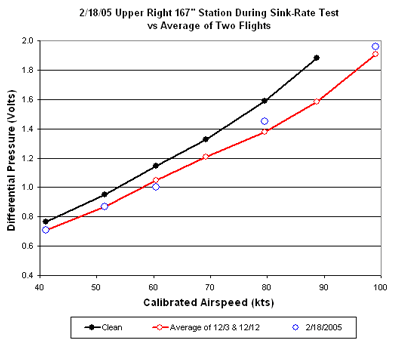
Figures 26 and 27 show drag probe data at two span stations on the upper surface of the wing during this flight. They show that the deturbulator behaved the same as on two previous flights.
The large deviations in the two data series (Figure 25a) indicates changes in the air mass movement as the glider descended, making the data from this one flight inconclusive. We will continue working toward a full span application of deturbulator on the upper wing surfaces and take enough data at that time for a conclusive indication of the effect on performance. We will then look at the bottom surfaces.
Jim Hendrix
Oxford Aero Equipment

|
|
|

|
|
|
Airspeeds shown in graphs are instrument calibrated. The aircraft airspeed system is not calibrated. Errors in the Standard Cirrus static/Pitot system bias the data towards higher speeds. This makes polars seem better than they really are. However, this is not an issue when the purpose is only to show comparitive data on the same glider.
| © Copyright 2003-2012 Jim Hendrix | Disclaimer |