|
|
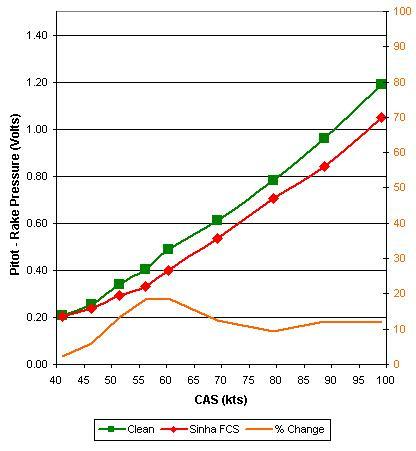
First successful test of deturbulator on a glider (9/17/2003)For the Standard Cirrus glider used in these tests, the inner wing panel, from the root to the aileron, is a linear transition zone from Wortmann FX S 02-196 to Wortmann FX 66-17 A II-182. The span of the transition zone is 164 inches. The drag rake (Fig. 2) was placed at the 52 inch station (Fig. 3), corresponding to a 32% transition from the root. Measurements were taken on the lower surface only, at airspeeds from 40 to 100 kts. Tests were conducted with the lower surface clean and with a 24 inch length of Sinha Deturbulator. Fig. 12 illustrates the results. The green curve is the clean wing and the red curve is the deturbulator test. The brown curve shows the percent reduction in drag. The greatest improvement was 19% from 55 to 60 kts. Below that range, it fell off to a few percent at 40 kts, and at higher speeds it holds steady at 10% to 12%. Notice that the drag is represented in Volts from the pressure sensor, rather than units of airspeed that Dick Johnson normally uses. Thus, this graph is proportional to the actual stagnation pressure on the drag probe which, in turn, is proportional to the drag force on the wing. The airspeed goes as the square root of the drag force, so a graph of airspeed would not give a correct impression of the actual drag reduction achieved. It is noteworthy that the drag reduction is more or less uniform for all airspeeds above 50 kts, with no measurable loss of performance at any airspeed. This is not surprising since, unlike turbulators, the Sinha device does not trip turbulence, taking energy out of the aircraft.
|
Airspeeds shown in graphs are instrument calibrated. The aircraft airspeed system is not calibrated. Errors in the Standard Cirrus static/Pitot system bias the data towards higher speeds. This makes polars seem better than they really are. However, this is not an issue when the purpose is only to show comparitive data on the same glider.
| © Copyright 2003-2012 Jim Hendrix | Disclaimer |