|
|
Leading-Edge-Tape-Only Performance Measurements (9/18/2010)
Two components constitute a deturbulator installation. First there is a thin tape applied to the leading edge of the wing. Its purpose is to present a small rear-facing step to precondition the flow as a necessary condition for deturbulator operation. The second component is the deturbulator panel located on the top surface at .6 chord just behind the normal reattachment point. Drag reductions on the top surface eluded us until LE tapes were used. After that, we began seeing reductions in drag-probe and sink-rate measurements. The LE tapes were viewed as a flow pre-conditioner to enable the deturbulator panels. However, the obvious question has always been "How would the LE tapes alone affect performance?"
Lower surface oil-flow images with LE tapes and no deturbulator panels consistently show that the transition bubble is eliminated or flattened. They also show an area of zero skin-friction from about .1 to .6 cord and a gentler, grazing angle, reattachment that produces less turbulent energy loss. Figure 1 below is an example. Clearly, such images indicate a superior solution to the transition bubble problem than conventional turbulator strips that are designed to trip the flow at a point ahead of the bubble.
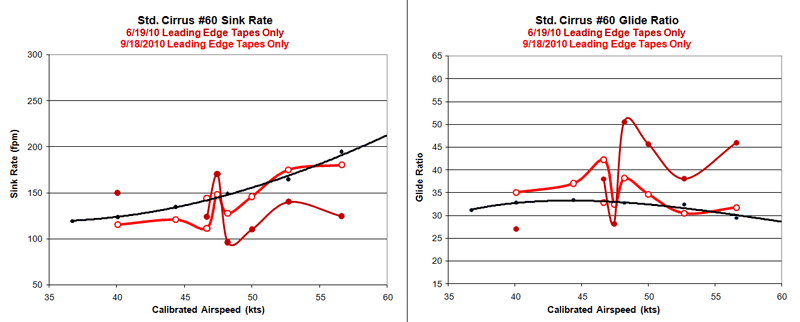
To date, two sets of sink-rate measurements have been taken with LE tapes only. The results are shown in Figure 2 below.

The most obvious feature of these curves is the performance notch at 49 knots indicated airspeed (KIAS) with large improvements just one knot on each side. Next we are struck by the similar shapes of the two curves and also the large amplitude difference. Since it repeats, the odd shape of the curves must be real. The reason for the large amplitude difference between the curves is a mystery. Nevertheless, is is clear that a judiciously sized and placed rear-facing step can be used to achieve large performance increases, at least at some airspeeds.
On 9/18/2010 (red curve, the 48 KIAS speed was measured over a period of three minutes. During that time the performance changed, most likely because I allowed the airspeed to drift toward 49 KIAS. Two points are plotted for that airspeed, showing the best and worst performance over periods of 1.2 minute during the speed run. Considering that a normal measurement period is 36 seconds, these points covering twice that time should be be good measurements. I chose to run the plot though the highest performance value, instead of the overall average, because it represents a real measurement. The point on the baseline closely matches the 49 KIAS value and I believe it is really a second measurement of the 49 KIAS point although it is plotted at the 48 KIAS coordinate.
See Humidity Dependency of Upper-Surface Leading-Edge Tape Effect for an explanation of the amplitude differences in Fig. 2.
On 6/19/2010 (maroon curve), the 45 KIAS point was wildly off base, so in this plot I omited it, leaving a gap between 40 and 48 KIAS.
Following is a video clip showing a Navier-Stokes simulation of flow dynamics behind a rear-facing step near the leading edge of a wing.
Video Clip 1. Navier-Stokes Simulation of Flow Dynamics Behind a Rear-Facing Step
For complete details on installing LE tapes, see 15% Cheap: A Practical Modification.
