|
|
Johnson Flight Logs Confirm Extreme Performance (10/2/2008)The sink rates measured by Dick Johnson and Jeff Baird, when they tested my deturbulated Standard Cirrus in December 2006, were obtained manually in Johnson's usual way by 1) setting the airspeed to hold for a data point, 2) reading the altimeter and timer at the start of the speed run, and 3) reading the altimeter and timer again at the end of the speed run. The measurement period typically included the time needed to lose 400 feet of altitude. This method is susceptible to human error in reading the altimeter (perhaps ±10 feet). Using a digital timer, the errors would likely have been negligible. However, for less experienced pilots than Johnson, errors might arise from the confusion of taking data while precisely piloting the aircraft. For the six deturbulated flights, a Cambridge 302 flight data recorder was automatically measuring altitude vs. time in four second intervals. Finally, after nearly two years, I have finished reconciling the logged data with the data manually acquired by Johnson and Baird. The results are graphed in the six images below. Each image includes a sink rate polar on the left side and the corresponding glide ratio plot on the right side. In each case, the manual data is plotted in brown and the log data in red. Two gross errors in the manual data were found. These are highlighted with red arrows in the 2nd and 4th flights. Both cases are good news. In the 2nd flight, the good news is that a point that was formerly thought to demonstrate a severe loss in performance now can be seen to be only 1/3rd as bad. In the 4th flight, a truly unbelievable point at 35 knots indicated (KIAS) is shown to actually be bogus. Finally, two instances of extreme performance (50 KIAS in flight 3 and 45 KIAS in flight 4) are very closely corroborated by the logged data, thereby eliminating human error as the source of these performance improvements.
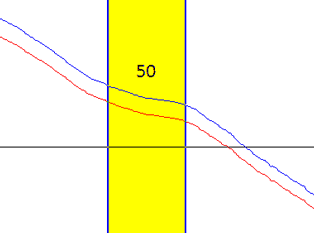
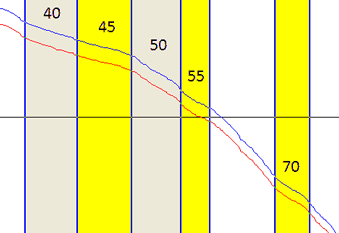
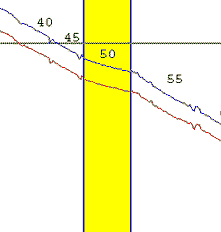
First, notice the close agreement between the measurements and the baseline at the lowest speed and at high speeds in all six flights. This argues against a general upwelling of the air mass. The low speed measurements were taken first, at high altitude, around 12,000 ft, and the high speed points were taken last, just above 4,000 ft. Agreement with baseline at both extremes further argues against a variation in air mass upwelling with altitude. But, it is possible to encounter small scale perturbations such as shear waves, for instance. However, the data argues against that too. If measurements of extreme performance result from rising air, then this glider has a strange habit of running into rising air just when it needs it and running out of rising air just when it no longer needs it. The following images show altitude vs. time profiles from three flight logs, one by Johnson, one by Baird and one by me a year later. KIAS values are noted in the time periods of the measurements and the highest performance regions are highlighted in yellow. Regions of lesser improved performance are gray. I count 10 instances where the profile flattens out upon approaching a performance airspeed or resumes a steeper angle upon leaving that airspeed. These are amazing coincidences if the improved performance is attributable to rising air.
One final point needs to be made. In the a former article (Johnson Flight Test) I pointed out a pattern of symmetries about the 50 KIAS airspeed in three of the six flights. This was illustrated in Fig. 33 of that article. That was based on the manual data. But, the same analysis based on the logged data is much messier and the repetition of the symmetry disappears. However, it remains strongly in the third flight. The following plots of sink rate deviations from a second order polynomial fit to each flight's sink rates show the difference.
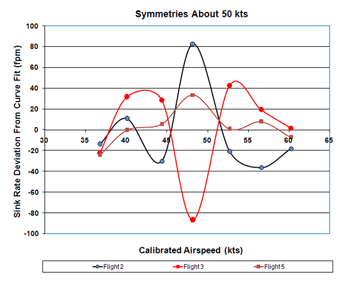
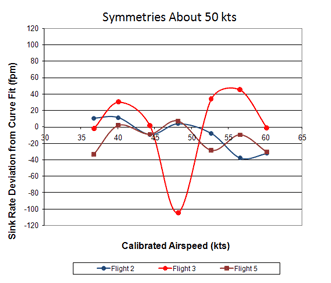
Manual Data (left) and Logged Data (right)
Jim Hendrix |
| © Copyright 2003-2012 Jim Hendrix | Disclaimer |