|
Oil-Flow Primer
One method of visualizing the state of boundary flows is to paint a surface with a visible fluid and then observe the
patterns in the fluid after subjecting the surface to the flow to be studied. There are high tech methods for
instantaneous images; however, a low tech method that has been used over the years is to use high viscosity
engine oil that has been drained from engines. The brown color contrasts nicely with the white surfaces
of glider wings and the high viscosity reduces running that can occur after landing. This method has
been used for this project.
|
|
Normal Upper Surface Oil-Flow (more)
|
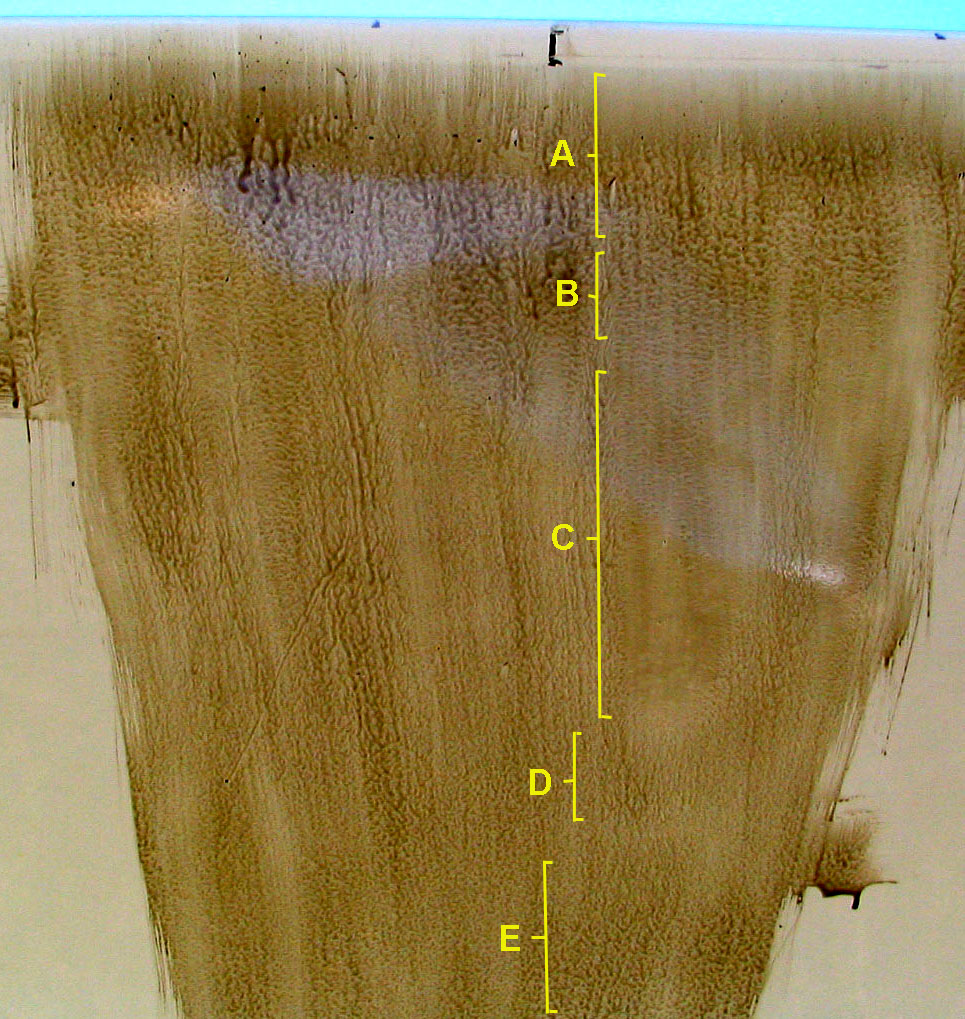
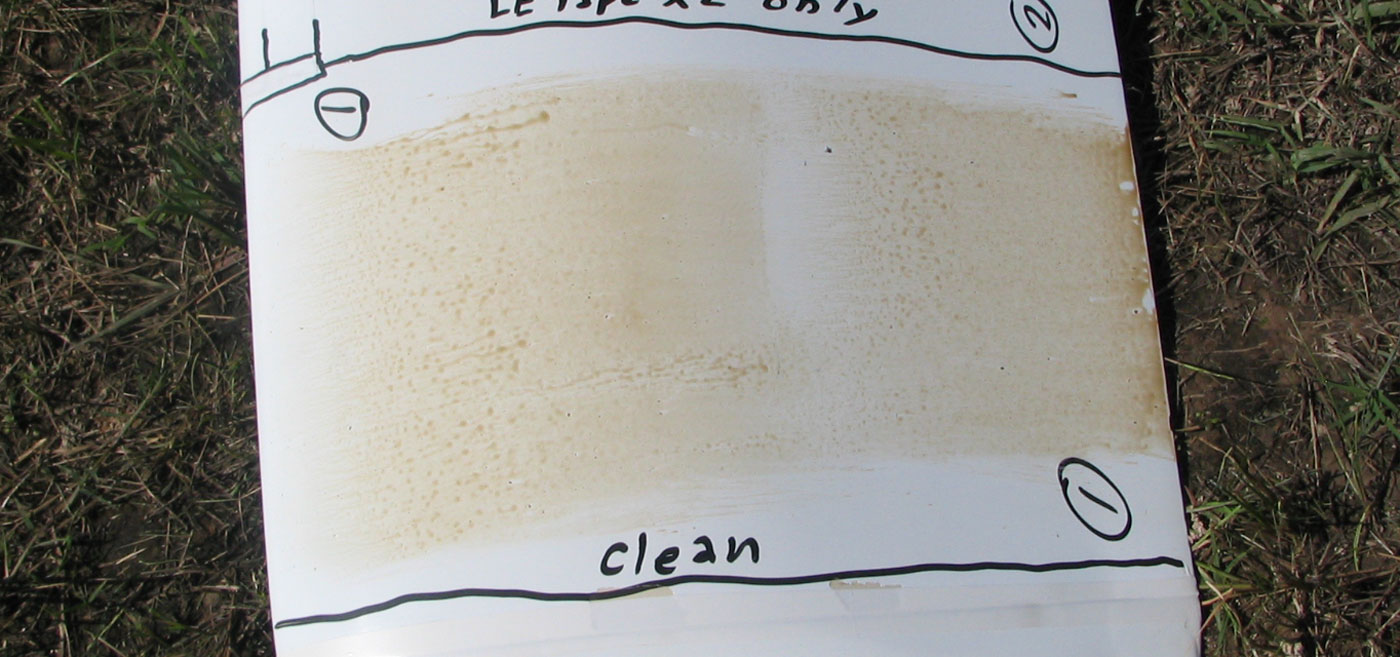
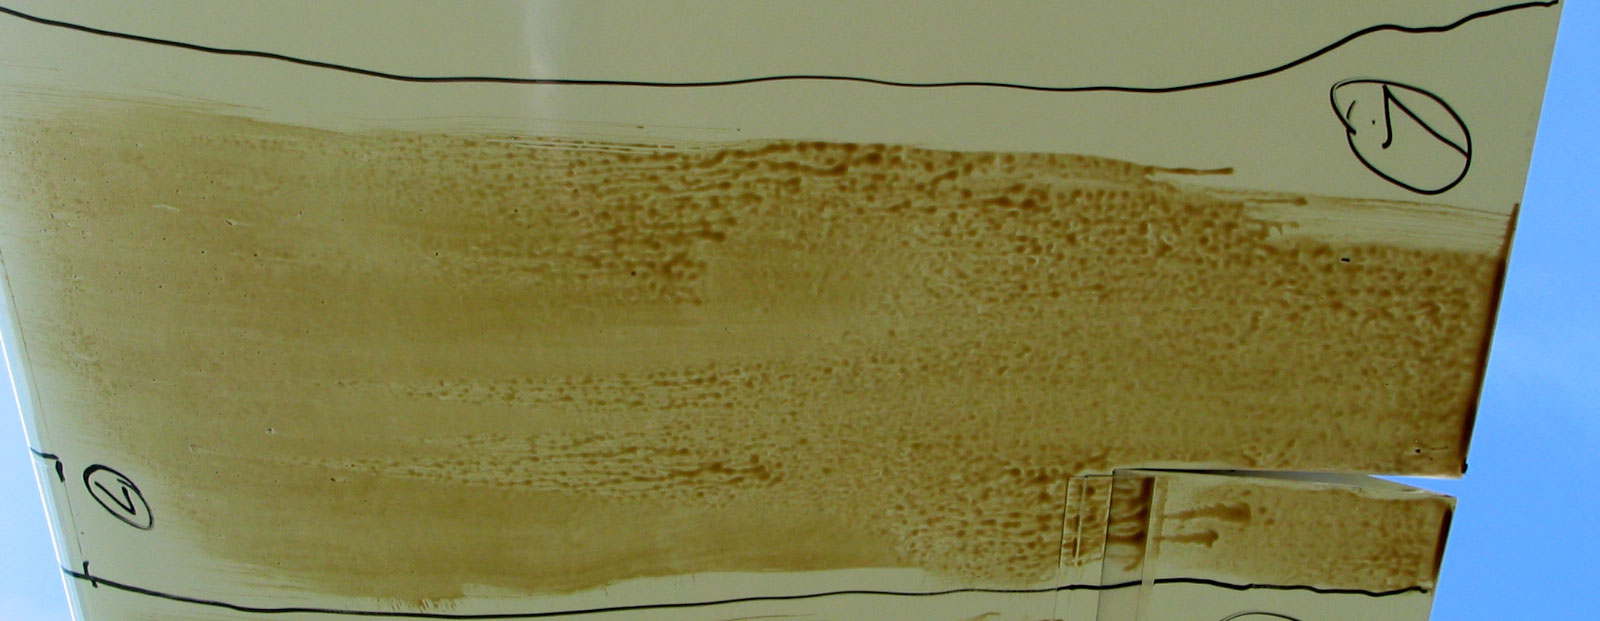
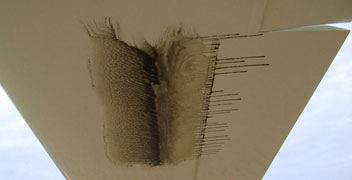
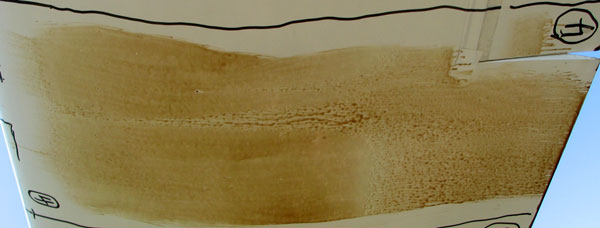
Four conditions are normally detected—attached laminar flow, detached flow, circulation bubble
and attached turbulent flow. This image shows normal patterns for these four conditions.
The clean surface near the leading edge results from attached laminar flow under high pressure.
This flow scrubs the surface clean.
Since laminar flow is uni-directed and since the pressure behind the leading edge of the wing decreases from the large
leading edge value until about mid-wing, the laminar flow has trouble following the camber of the surface and so
gradually detaches with increasing height behind the attached laminar region.
The increasing thickness of the streams in the detached region indicates the reduced influence
of the flow on the oil as the flow lifts away from the wing.
If nothing happens first, the streams would simply end (stop flowing) at the point where the flow is too high to touch them.
However, before this occurs, the onrush of the free stream flow and the increasing (adverse) pressure gradient turns the
detached boundary flow downward until it
impacts the surface at a steep angle where the flow reattaches to the surface. This point is seen in the image as a
clean line behind the obvious band of collected oil.
The violent impact scrubs the surface of oil. The impact in this regions generates a lot of turbulence which flows aft
as attached turbulent flow. The oil in this region resembles the detached flow region, but in fact is caused by
turbulent flow in contact in contact with the surface. As the attached turbulent flow moves aft, the level of turbulence increases
and the boundary layer thickens to a few inches at the trailing edge.
|
|
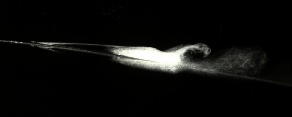
Smoke Image (click to enlarge)
|
The band of collected oil in front of the reattachment point is a circulation bubble where the flow
on the surface rotates forward. In this case the bubble is called a "transition bubble" because it occurs where the flow
transitions from laminar to turbulent. Because of this reverse circulation, oil is collected in this region.
The broad, flat runs of oil from the leading edge of the bubble do not represent flight conditions. Rather, in flight, a
thick line of oil collects at the fore of the circulation bubble where the aft and forward flows collide and lift upward.
After landing, gravity pulls this thick collection of oil backward into the bubble region.
The figure on the left (by Greg Cole and Prof. Mueller at Notre Dame) beautifully illustrates a transition bubble.
Consider this discussion a baseline for interpreting the deturbulated oil-flow visualizations that follow.
Lower-Surface Split Oil-Flow Images With and Without 12mm Tape (10/1/2011)
10/1/2011
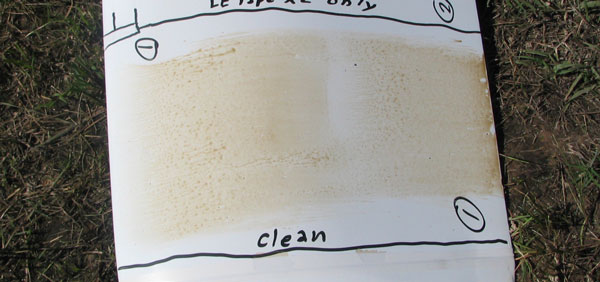
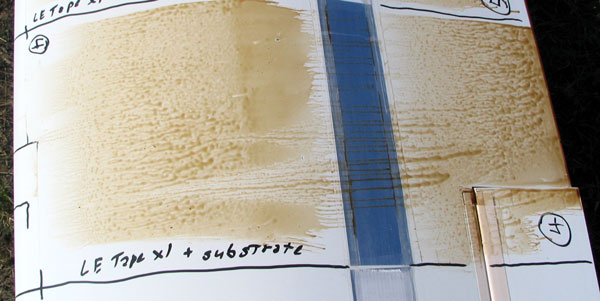
On 10/1/2011, I tried to take oil-flow visualizations with side beside examples of the clean and taped lower-surface leading edge, using
Tesa 4104, 12mm, White tape. Such split oil-flow images catch the two leading edge treatments under identical conditions.
The procedure was flawed, however, by two factors. First, I applied the oil too near the leading edge, so that it tripped the flow, leading
to streaming of the oil all the way to the trailing edge without a normal transition from laminar to tubulant flow with a classic bubble.
The other problem was that by the time I launched, it was afternoon and there was a lot of turbulence, making it impossible to hold a
constant airspeed. This tends to tubulate the flow and smears the features in the oil from leading to trailing edge. Nevertheless,
sufficient change appears to have occurred in the taped zones to indicate effectiveness even in turbulent air. Better images will be taken
later.
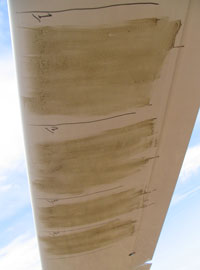
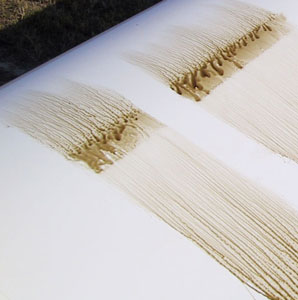
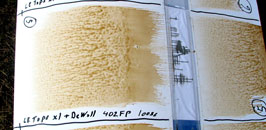
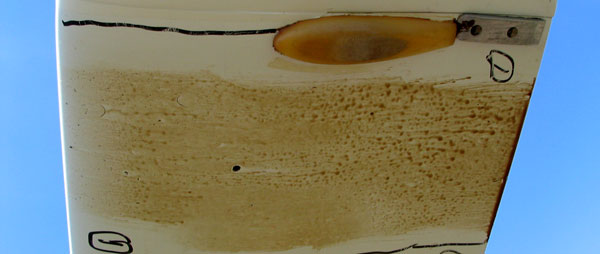
Figs. 1 and 2 show an oil swath at 12.75 ft (3.9 m) from the wing root before and after the flight, respectively. I attempted to hold 65 kts, but was
not able to maintain it consistently.
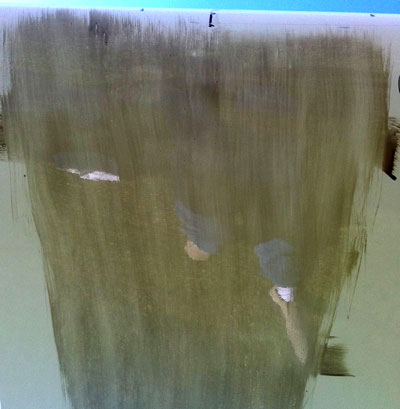
Figure 1. 12.75 ft (3.9 m) Span Station Before 65 kt Flight
|
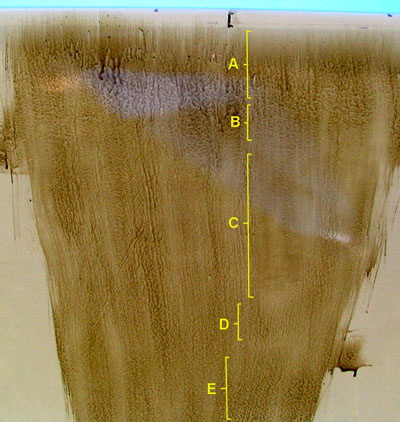
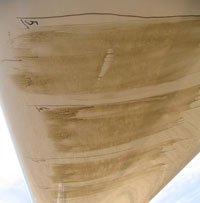
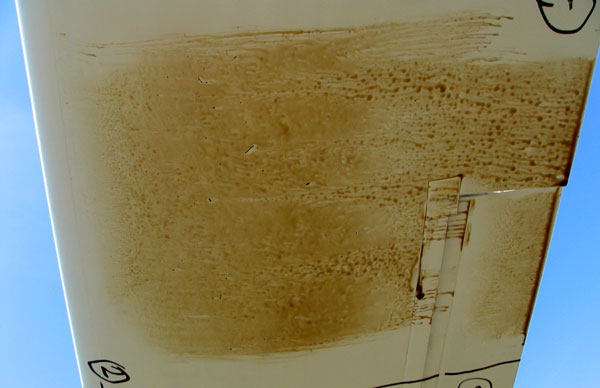
Figure 2. 12.75 ft (3.9 m) Span Station After 65 kt Flight
|
The first thing to note is the generally softer appearance of a large region of the oil on the right side of Fig. 2, downstream of the tape.
The left edge of the tape is marked in black. These soft areas show the oil mostly undisturbed from the original patterns left by the brush
strokes as shown in Fig. 1. The region begins between zones B and C, marked in yellow, and extends as far back as zone E.
This is far beyond
the extend of the normal transition bubble for the speeds flown. See Figs. 3 and 4 below, which show the bubble position and extent for
60 kts and 70 kts.
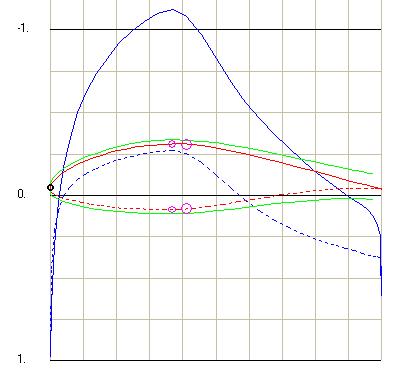
Figure 3. Simulated Position of Transition Bubbles at 60 kts
|
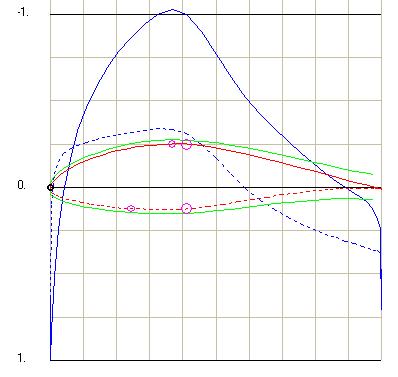
Figure 4. Simulated Position of Transition Bubbles at 70 kts
|
In zone A, the oil is being dragged aft by the flow, until it rises above the surface too far to pull the oil along with it. In zone B, it becomes
clearly detached. This stands in contrast with the untaped side of the swath. Except for one trail of turbulent attached flow, started by
three specks of debris (click to expand the image), the flow is essentially off the surface in zone C. The region between zones B and C shows
horizontal light lines in the oil, possible indicating the forward part of a gentle reverse flow where it encounters the aft flow picking it up
to form a very wide, flat circulation bubble. The light regioin at the rear of zone C is where the flow descended back onto the surface. Comparing
this to the pre-flight image makes it clear that the lightness was caused by the flow, not the original application of the oil.
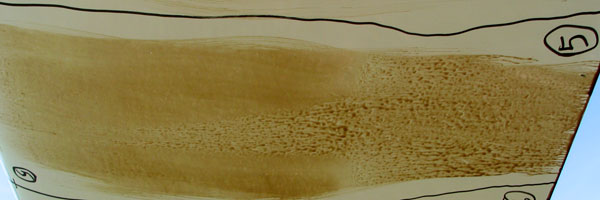
A normal reattachment behind a bubble occurs at a fairly steep angle and tends to scrub the oil off the surface more than Fig. 2 shows. This
implies a grazing reattachment angle and a very much flattened residual bubble. Fig. 5 shows a normal pattern with the bubble region obviously
indicated. It should be noted that the transition bubble on the bottom of a Wortman airfoil moves forward and widenes with increasing speed
and backward with reduced speeds. This smears the oil patterns when the airspeed is allowed to swing, as occurred in the present flight.
It is noteworthy, that even in undesirable conditions for testing, the taped region of the wing obviously appears to have worked metter
than the untaped region. This indicates that at least some of the positive effects from the tape continue to work in the turbulence of
normal soaring flight.
Finally notice the uniform region of attached flow at the rear of the wing in zone E. This is a greatly reduced area compared to the untaped
side of the swatch. As mentioned, the oil, being applied so close to the leading edge, may be tripping the flow causing the entire left side
os the swatch to be covered with attached turbulent flow. there should be detachment of the laminar flow, a bubble circulation region that collects
oil, a light zone where reattachment occurs and attached turbulent flow from there back.
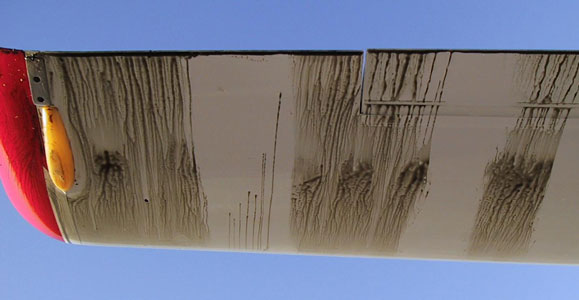
Figure 5. Normal Lower-Surface Transition bubble Near Wing Tip
|
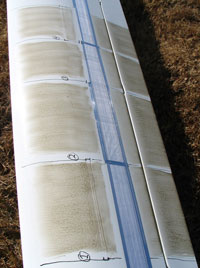
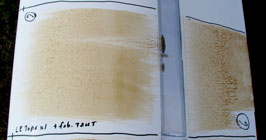
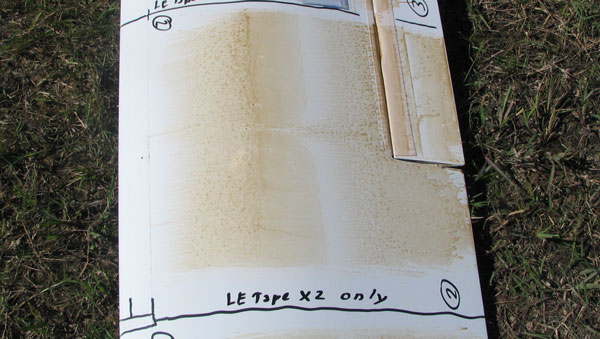
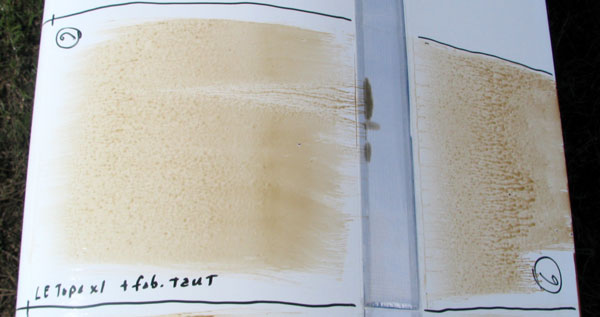
Figs. 6 and 7 show an oil swath at 20.8 ft (6.4 m) from the wing root before and after the flight, respectively.
Zone A of Fig. 7 shows a very obvious smooth, square shaped region behind the tape that worked well. the horizontally oriented waves
in zone B are clear evidence of gentle forward flow encountering the aftward flow that lifts it away from the surface. The rear part of zone A shows
a very gentle reattachment with very little lightening of the oil where the turbulence begins to form.
Zone C on the left, where there is not tape, also shows smooth oil. This is a region where the oil was not applied too close to the leading edge
and did not trip the flow. This evidences a weak bubble that is normal so far out near the wing tip. It may be argued that zone A is nothing but
the same. But, zone A is wider, in the streamwise direction. and is in a region where the oil is too close to the leading edge.
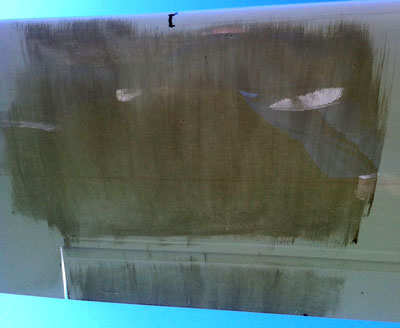
Figure 6. 20.8 ft (6.4 m) Span Station Before 65 kt Flight
|
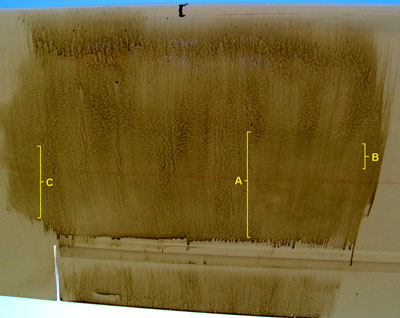
Figure 7. 20.8 ft (6.4 m) Span Station After 65 kt Flight
|
11/4/2011
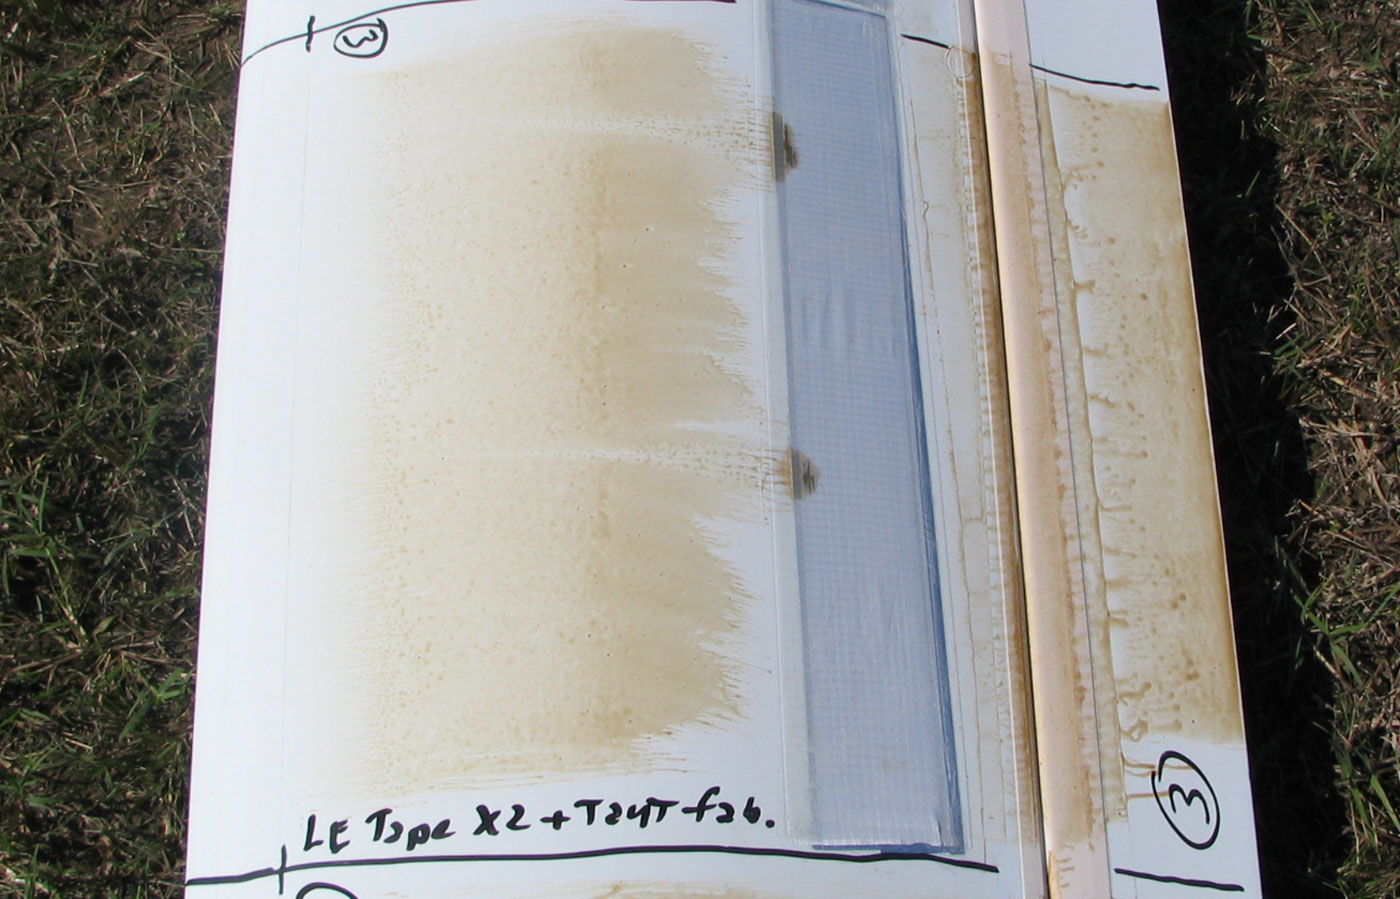
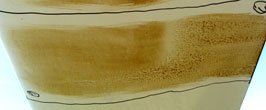
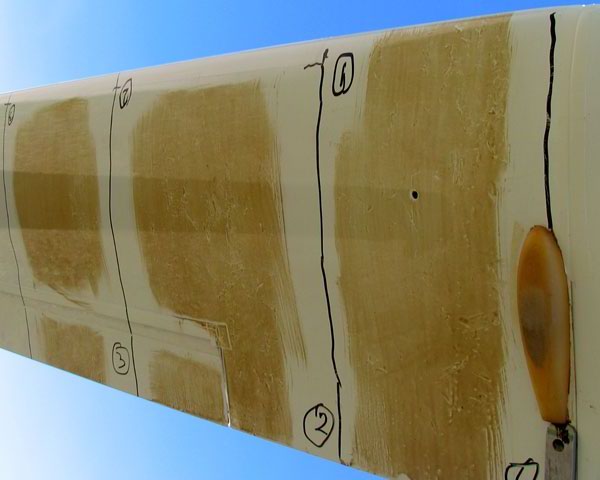
On 11/4/2011, additional oil-flow images were taken with swaths split between taped and bare lower-surface leading edges.
Although the air was smooth, the quality of the images was not as good as hoped. Nevertheless, the oil swath located 12 feet
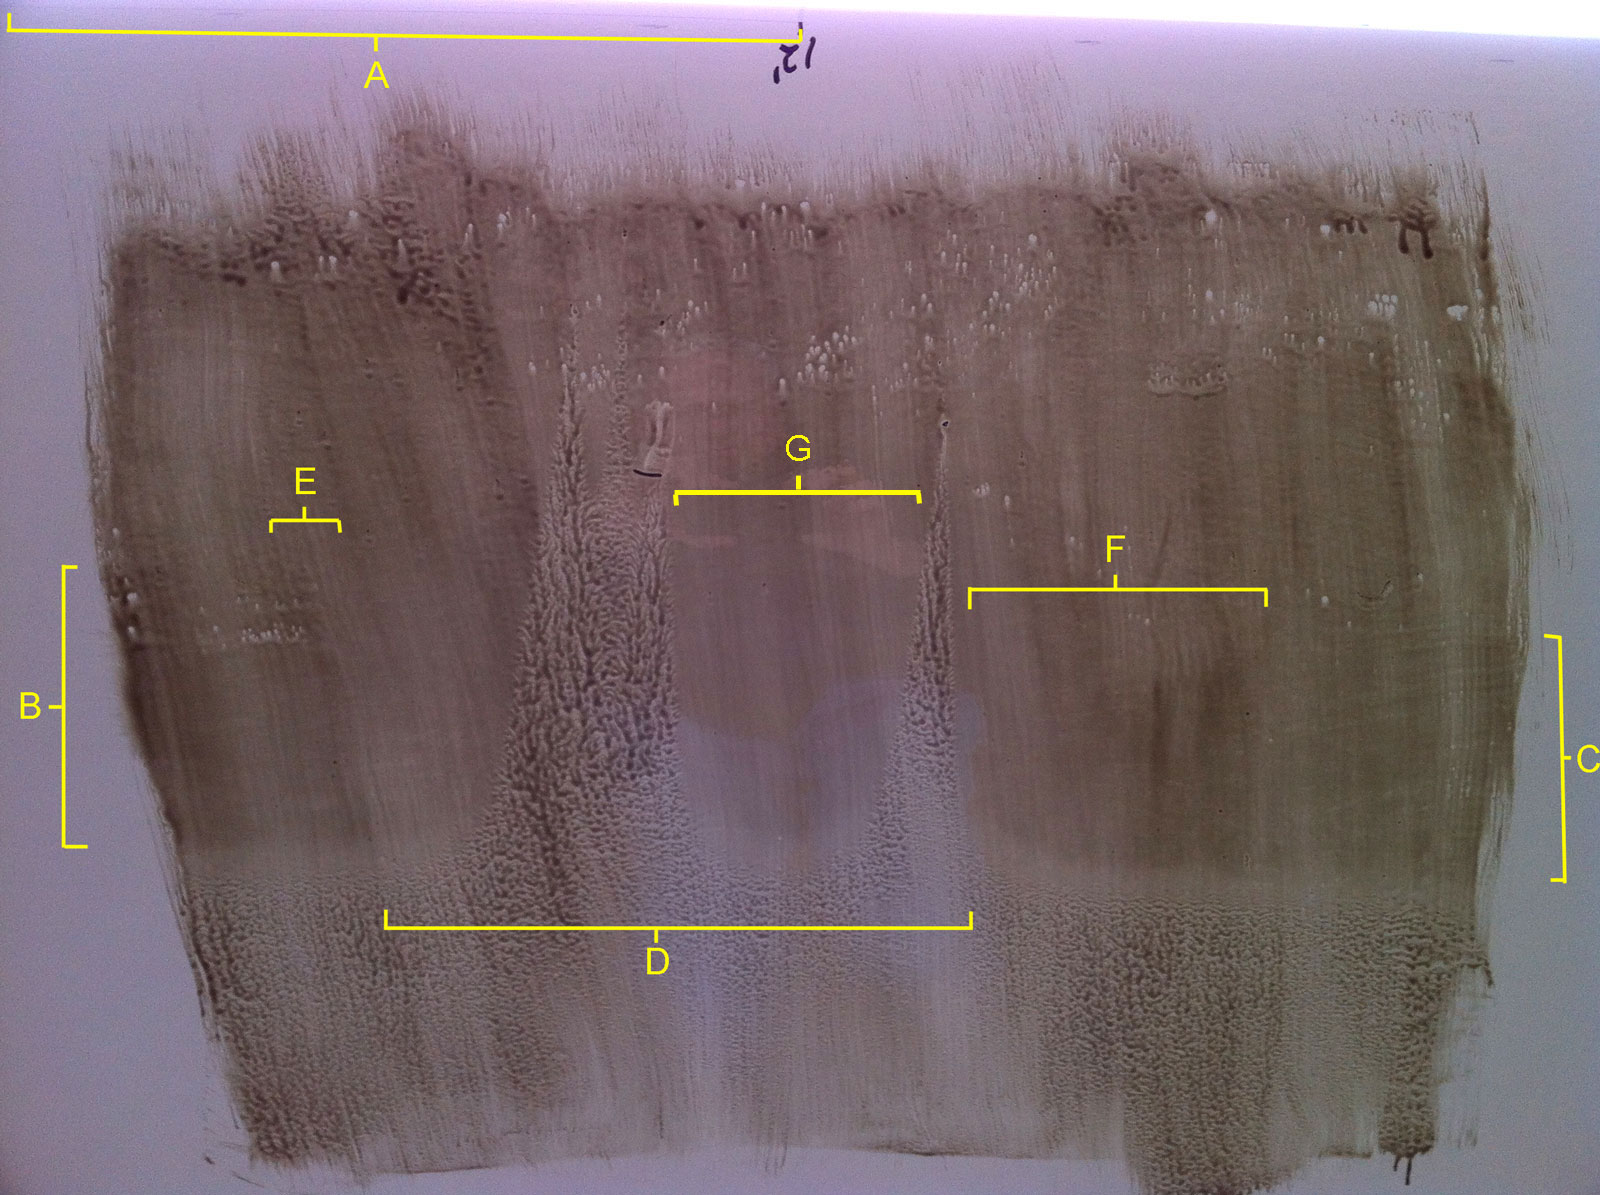
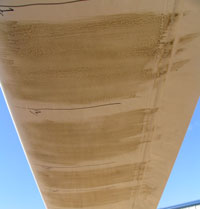
from the wing root contains several clues. Areas of interest in Fig. 9 are bracketed with yellow lines and labeled A-E. In both images
the leading edge is at the top. For this flight, the relative humidity was about 70% and the temperature was 51º F (10.6º C).
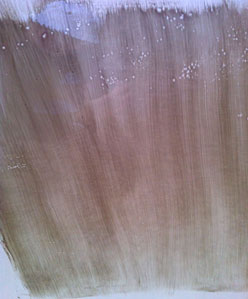
Figure 8. 12" (3.66m) Span Station Before 70kt Flight
|
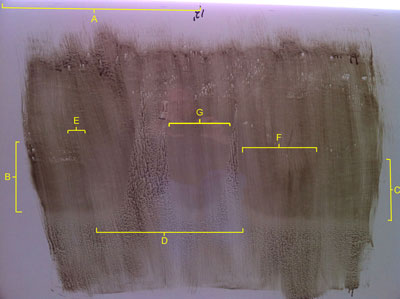
Figure 9. 12' (3.66m) Span Station After 70kt Flight
|
A indicates the location of the tape.
B and C highlight regions of darker oil that define the presence of circulation bubbles.
The light band at the bottom of these regions is the reattachment line where the reattaching flow tends to wipe the oil from the surface.
The reattachment line on the left side, behind the tape, is noticeably closer to the leading edge than the one on the right side,
where the leading edge is clean.
Below, down stream from, the reattachment line, the blotched streams of oil indicate attached turbulent flow.
Additional areas of turbulent attached flow appear as wedges that start hear the top of the image. These were triggered by debris
that became stuck in the oil during takeoff from the grass runway. The wide one on the left started at three points and merged into one
wide stream of turbulent attached flow. the norrow one on the right illustrates the turbulence that just one speck of debris can cause. Although
these marred the image, they did not totally destroy it's usefulness.
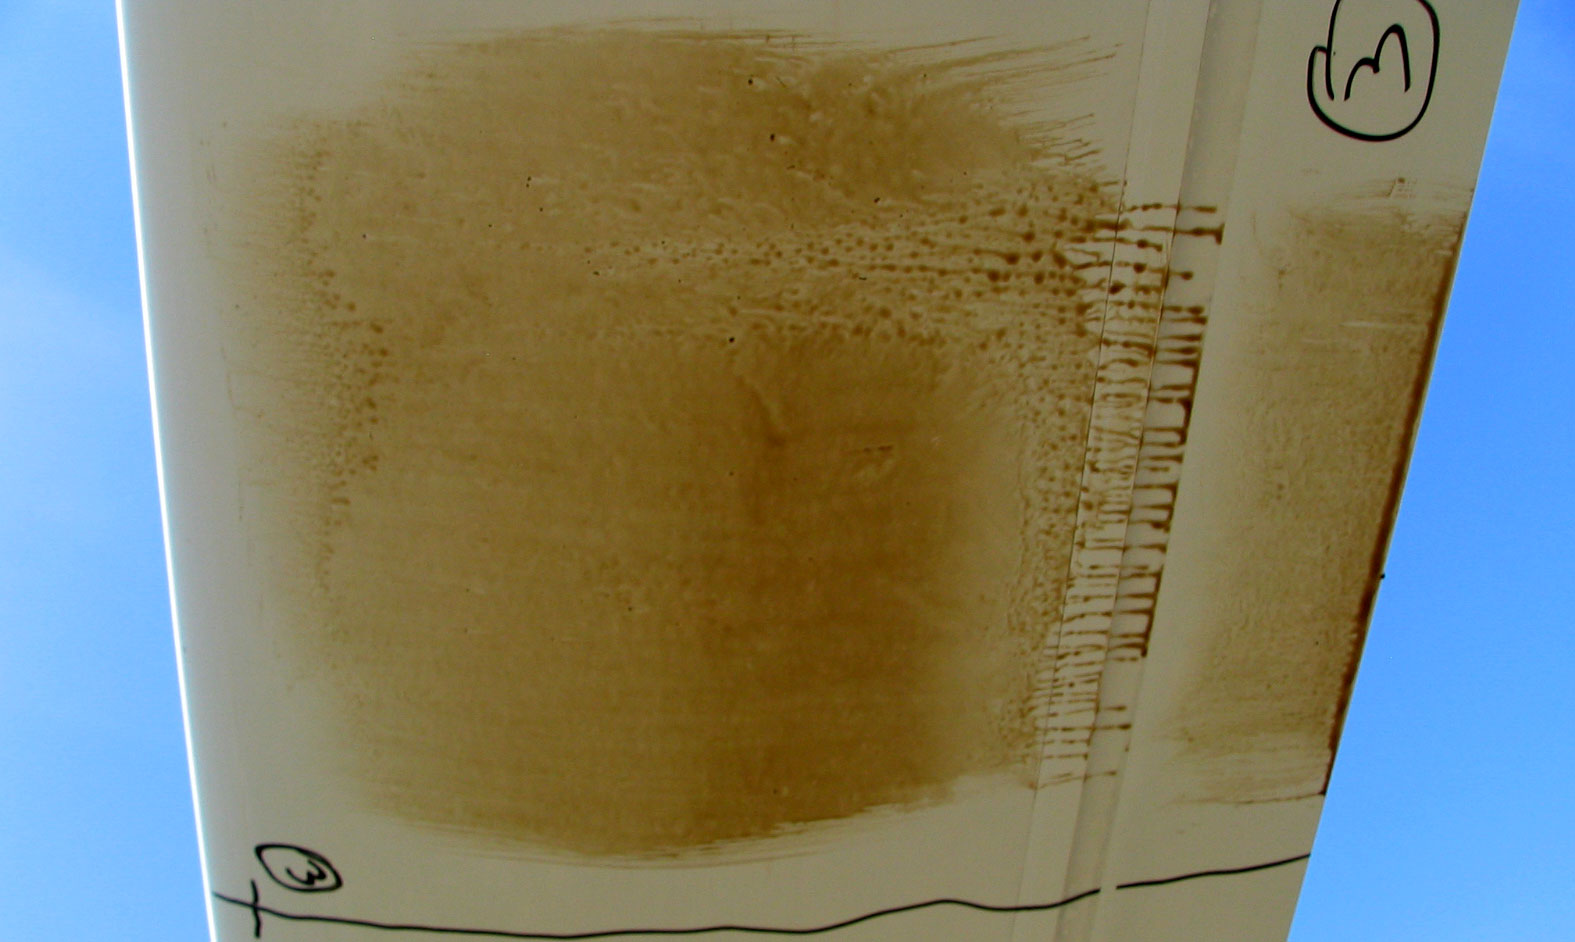
In a circulation bubble, as in zones B and C, the flow on the surface moves backward, from trailing to leading edge, and is much slower
than the detached flow over the top of the bubble. The circulation traps oil, not allowing it to stream aft past the reattachment line. The oil in these
zones becomes smooth and soft looking, revealing only the original brush strokes. An obvious difference between the bubbles at B,
behind the taped leading edge, and C behind the clean leading edge, is that one is wider and farther forward than the other.
Clearly, the the tape has the effect of flattening and widening the bubble, and moving it forward.
It is interesting that the inside end of the bubble at C,where it is truncated by a narrow wedge of turbulent attached flow,
narrows to a bullet nose in region F. This is because it is necessary for the hight of the bubble to come down as it approaches
the attached flow at the left end of F. And, as the hight decreases, so too must the width.
The bubble at B, behind the tape, also appears to end in a bullet nose, but it is harder to see because the oil on that region,
on the right side of E, was applied lighter than on the left side. Nevertheless, the general smoothness of the bubble zone can be seen
between E and the wide turbulent stream. And, it can be seen that it ends in a blunt bullet nose shape.
Region G, between the streams of turbulent flow, shows no indication of a bubble, only the original brush strokes all the way
back to the reattachment line, which is farther forward than on the right side. This appears to be a region where the tape flattened the bubble
almost entirely.
Although, the quality of this oil-flow visualization is lacking, it nevertheless shows indications of the tape working. This is seen in the
forward relocaation and widening of the bubble behind the tape, and an absence of a bubble indication in region G. In contrast, on the
right side, where the leading edge of the wing is clean, the bubble is consistently narrower, and presumably higher, and is located farther aft.
First Deturbulated Oil-Flow Visualizations
|
|
Normal Bottom Surface Oil-Flow (more)
|
After the Johnson test series in December 2006, we installed two deturbulator applications that failed and a third
one that worked but had problems initially. To investigate the problems, I staged two flights for the purpose of
obtaining oil-flow visualizations to help diagnose the problem. One flight was at 50 kts indicated, to see
what was happening at the 50 KIAS performance peak, and the other was at 80 kts indicated for a high speed indication.
In each case, the airspeed for from launch to landing was kept as nearly the on target as safety allowed.
The configuration tested by Dick Johnson included a thin tape around the leading edge to initiate detached flow just behind the
leading edge of the wing where the edge of the tape produced a sudden step down.
Also, a similar thin tape (the "intermediate tape") was located just in front of the deturbulator panels.
We thought the performance issue may have been caused by the intermediate tape tripping the flow, whereas that did not occur
with the former installation. But the new installation included redesigned deturbulator panels and we had a problem.
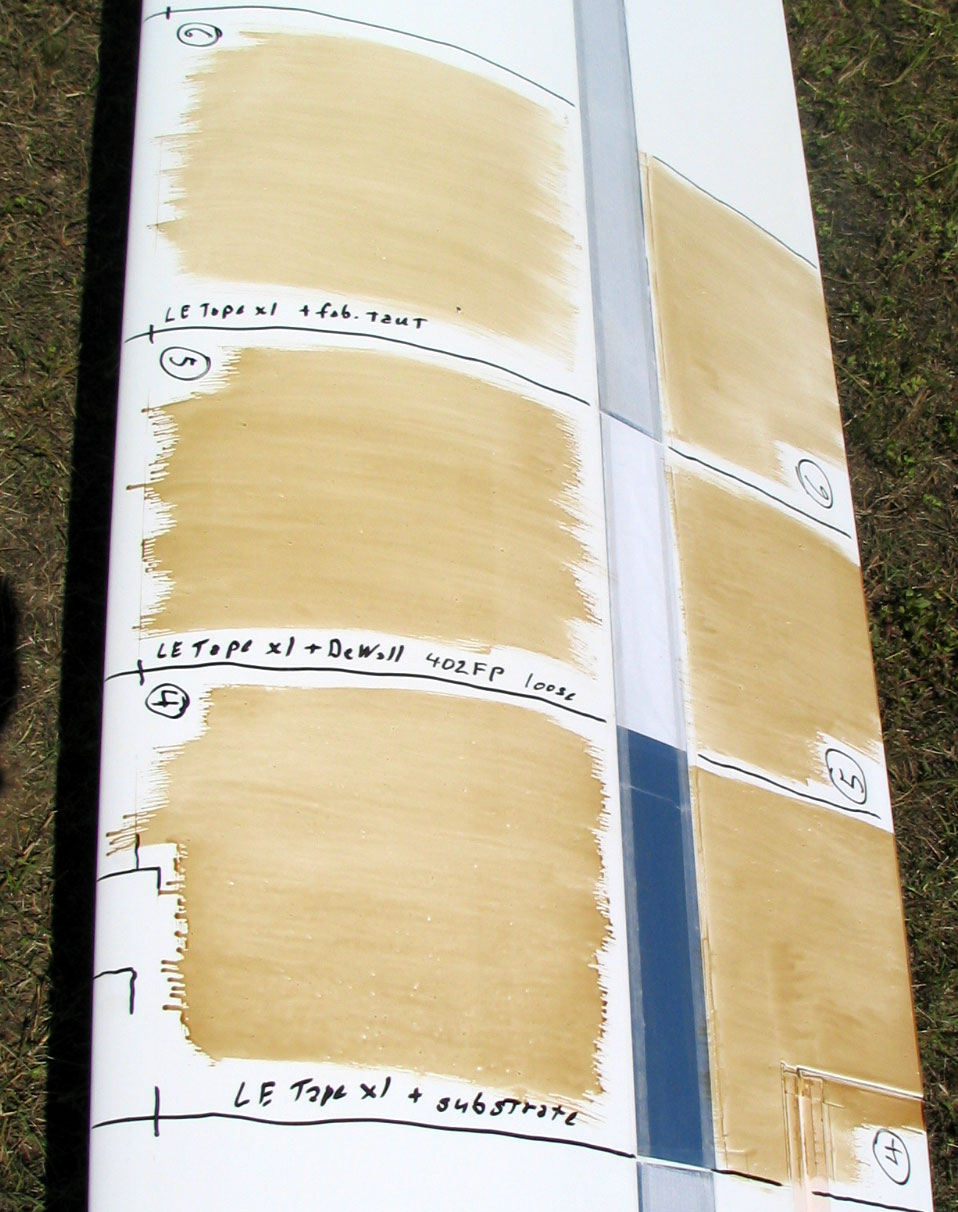
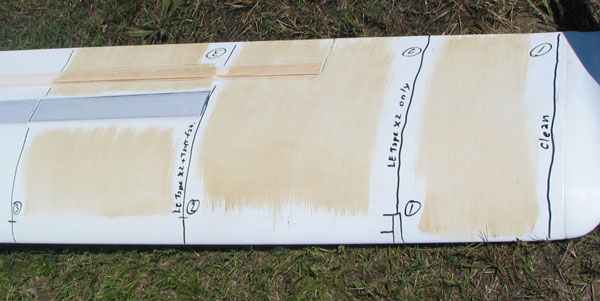
Four configurations of tapes in front of the deturbulator strip were tested at two span stations. Test regions 1, 2, 3 and 4
were located on the aileron panel of the left wing and test regions 5, 6, 7 and 8 were located midway between the right wing
root and the air brake where the airfoil is substantially different. The test configurations were as follows:
| Section |
Intermediate
Tape |
Deturbulator
Panel |
| 1 & 5 |
with Tesafilm leading edge smoothing tape |
unsmoothed leading edge |
| 2 & 6 |
no intermediate tape |
unsmoothed leading edge |
| 3 & 7 |
no intermediate tape |
with Tesafilm leading edge smoothing tape |
| 4 & 8 |
with Tesafilm leading edge smoothing tape |
with Tesafilm leading edge smoothing tape |
Below are thumbnails of the oil-flows from the two flights. Click an image for individual images of the test sections.
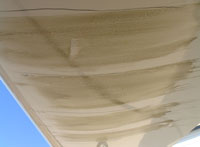
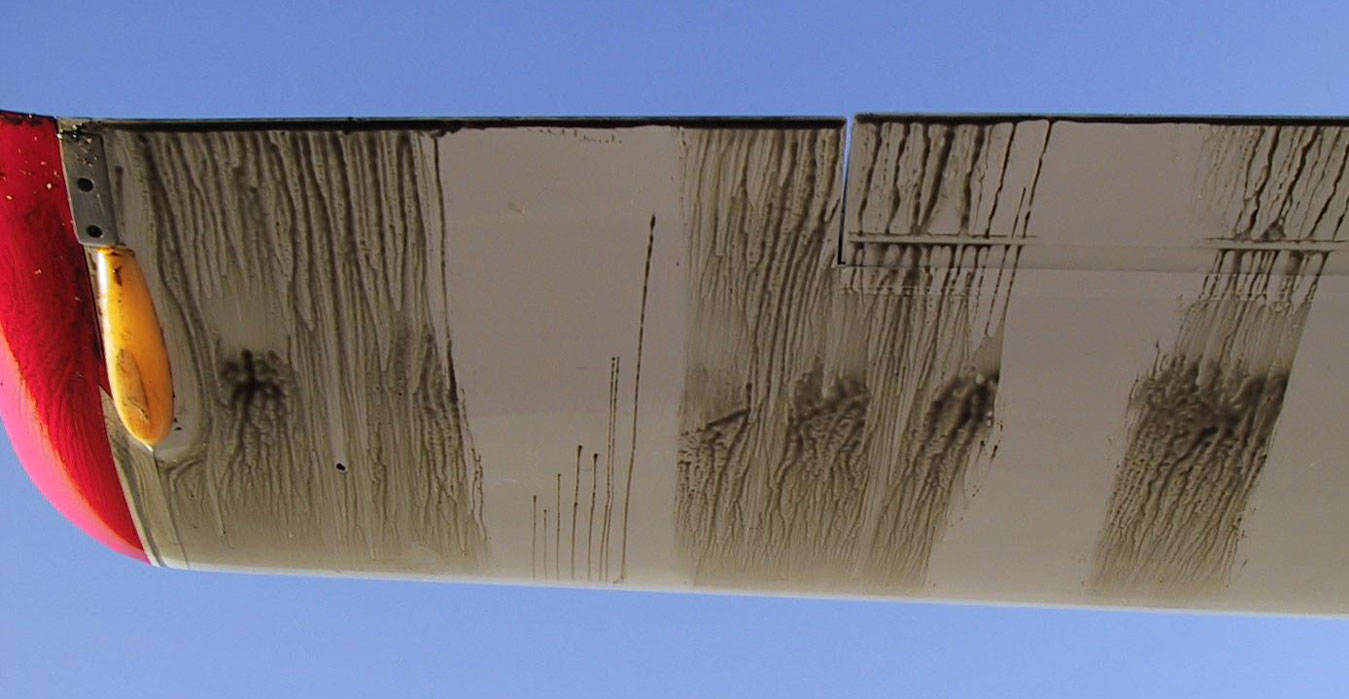
Before that, however, notice the overall difference between the deturbulated oil-flows below and the normal one discusseed above.
It can be seen that only a faint suggestion of a transition bubble remains on the upper surface.
The bottom surface shows no trace of a transition bubble, although a very definite one occurs when the wing is clean, as
seen in the image on the right.
Also, it is apparent that there is no streaming of the oil in the detached laminar and attached turbulent
flow regions. These indications are clear evidence of
marginally detached flow over most of the wing surfaces of an aircraft in actual flight.
Click below for a complete set of detailed images from the 50 kt flight.
Click below for a complete set of detailed images from the 80 kt flight.
Second Deturbulated Oil-Flow Visualizations
Additional oil-flow visualizations were taken to see the effects of variations in the tension of a fabric
deturbulator membrane. Also, a synthetic membrane was tested. These images show the reattachment point on the bottom surface
at 60 KIAS.
Click below for a complete set of detailed images with comments.
 Detailed Images from Flight on 5/30/2009
|
Oil flows at 60 KIAS with Parachute Fabric Membrane
(click to enlarge images)
The oil-flow images on this page were taken using porous deturbulator membranes. Mostly the sections use parachute
rip-stop fabric. One section uses DeWALL 403FP plastic. Also, included are sections with the bare, exposed
deturbulator substrate. Finally, clean wing sections are included with and without leading edge tapes.
The quality of these oil-flows is less than desired, mainly because the high temperature (about 90 degrees F) caused
the oil to spread and run. Nevertheless, intelligible information can be read from them and I shall include my
comments with each image below.
The flight producing these images was flown at or as close to 60 KIAS as possible, from launch to touchdown. What looks
good or bad at this speed at any span station and deturbulator configuration may look different at another speed. 60 kts was
chosen because it produced a good performance point and could be flown safely on tow.
Test sections below that appear to be working well are highlighted with a yellow background color.
It is easy to get impressive oil-flow images that suggest extraordinary drag reductions, but to date it has been difficult
to repeat instances of extreme performance improvements. (Six have been reported on this web site and a few more have not yet
been written up in progress articles.) I take this to mean that it is not sufficient to achieve detached flow over
areas that formerly had attached laminar or turbulent flow and to flatten the transition bubble. Achieving precise conditions
for extreme performance probably involves subtilties that can be quantified in wind tunnel testing but may not show up in
oil-flow visualizations.
HINT: If you are using a late version of Internet Explorer, after clicking to expand an image, you can enlarge it further
for a really close in look. Presumably, other browsers have a similar feature.
| Sections 1, 2 & 3 - Top Side - Before Flight |
|
|
Top surface of sections 1, 2 and 3 near left wing tip before flight.
|
| Section 1 - Top Side - After Flight |
|
|
This is a section of clean wing at near the wing tip. The pattern is normal. Attached laminar flow at the leading
edge scrubs away most of the oil over the first tenth of the chord. As the laminar flow gradually leaves the surface
the oil streams in trickles that thicken as the separation gap widens until the flow no longer touches the oil at about
.3 chord. From there to about .45 chord, the separation is too high to influence the oil. The leading edge of the
circulation bubble is encountered at .45 chord. The Smooth region from there to about .6 chord results form the low
speed reverse flow on the surface at the bottom of the bubble. The sharp clean line following the bubble is where
the flow returns to the surface at a fairly steep angle and scrubs the oil away. Turbulence generated at this point
flows aft. It appears in this case, that the turbulent flow remains attached only to about .8 chord and then separates
before reaching the trailing edge.
A flaw on the surface can be seen to trip the flow at about .3 chord producing a widening stream of attached turbulent
flow that widens as it plows through the transition bubble and the normal reattachment region behind. This illustrates
why glider wing surfaces need to be absolutely clean and smooth.
|
| Section 2 - Top Side - After Flight |
|
|
This section is clean except for a thin tape around the leading edge. The tape is only about .002" thick,
not enough to trip the flow.
Comparing this section to section 1 above, it appears that the flow pattern is still normal except for
some movement of the transition points. The following comments assume a comparison to section 1 above.
There is a speck on the surface that trips the flow and produces a widening swath of attached turbulent
flow that plows through the bubble and reattachment regions directly into the aft turbulent attached flow.
The aileron seal tape appears to be doing more harm than good. To this point, I have been doing deturbulator work
without a top aileron tape. Blow-through from below is stopped by bottom surface pre-curved Mylar seals and internal S-seals.
I will remove the tapes again.
|
| Section 3 - Top Side - After Flight |

|
|
This is a fully deturbulated section with taut parachute fabric for the membrane, but it appears not to be working well,
perhaps because it is so near the wing tip and the configuration is not right.
The laminar lift-off and bubble convergence points are at .14 and .38 chord respectively, not appreciably changed compared
to the section above with no deturbulator panel. However, in this case no reattachment point cannot be seen because of the
deturbulator panel. So, what is the effect of the deturbulator on this section?
First, notice that the dead zone ahead of the bubble is noticeably less featured than in section 2 above.
The laminar lift-off line has lighter and shorter oil streams. Pieces of oil were not dragged into the dead zone as before.
Also, the convergence line is less pronounced, implying perhaps a flatter bubble height with less lifting along the
convergence line. These changes are in the right direction, but are not likely very helpful.
Again, the aileron sealing tapes appear very disruptive and might have an effect on the overall flow stream.
|
| Sections 1, 2 & 3 - Bottom Side - Before Flight |
|
|
Bottom surface of sections 1, 2 and 3 near left wing tip before flight. The wing tip got into the grass which scratched up
the oil a bit.
|
| Section 1 - Bottom Side - After Flight |
|
|
This is not a very good image of normal flow at the wing tip on the bottom surface. Nevertheless, there is
evidence of a broad transition bubble in the smooth region at the bottom of the image from .3 to .7 chord.
The small hole is for winglet attachment and trails a swath of turbulent attached flow.
|
| Section 2 - Bottom Side - After Flight |
|
|
This is the bottom of a section near the wing tip with tape around the leading edge.
The thickened oil deposit between .35 and .6 chord is evidence of a mild circulation bubble that appears to be
less pronounced than normal (see Normal Oil-Flows Near the Tip below).
It is clear, because of the absence of a distinct clean region behind the dead zone, that the reattachment at
.6 chord is at a shallow angle, implying that the bubble is not as thick as a normal transition bubble and should have
less form drag.
Again we have three nice examples of debris initiated swaths of attached turbulent flow interrupting the dead zone
and flowing into the turbulent flow at the rear of the wing.
|
| Section 3 - Bottom Side - After Flight |

|
|
This is the bottom side of a section with a deturbulator panel on the top surface that used parachute fabric stretched taut
as the membrane. Being on the outer wing panel and flying at 60 kts, the upper surface did not show promising results
for improved performance.
The dark region indicates a collection of oil in the reverse circulation of a feeble transition bubble. This bubble appears
to be both gentle and not very tall. This is indicated by the blended edges of the bubble zone and the absence of a clean
surface where the flow reattaches at .7 chord. Also the remnants of the original brush strokes suggests that the gentleness
of the reverse flow.
The reason for the sharp reattachment line appears to be an up stream influence from the gap seal tapes. Perhaps using a thinner
anti-peal tape would help.
The pattern on the aileron appears to show some benefit from the trailing edge of the mylar seal. The usual
turbulent attached flow streams are absent and the original brush strokes are evident in the undisturbed oil that remains.
In summary, this appears to be a beneficial flow pattern with very little skin friction except on the leading edge tape
and at the gap seals. Except for contamination in the prior image (with no deturbulator panel on the top surface) this pattern
is very similar.
|
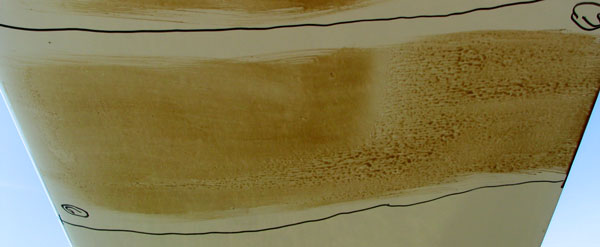
| Normal Oil-Flows Near the Tip (10/29/2003) |
|
|
|
Oil flow image of bottom of the left wing tip with no deturbulators or leading edge tapes installed.
A thicker application of oil was used with the result that there is more streaming and more oil collected
in the circulation bubble. This image is included for comparison to sections 2 and 3 above.
|
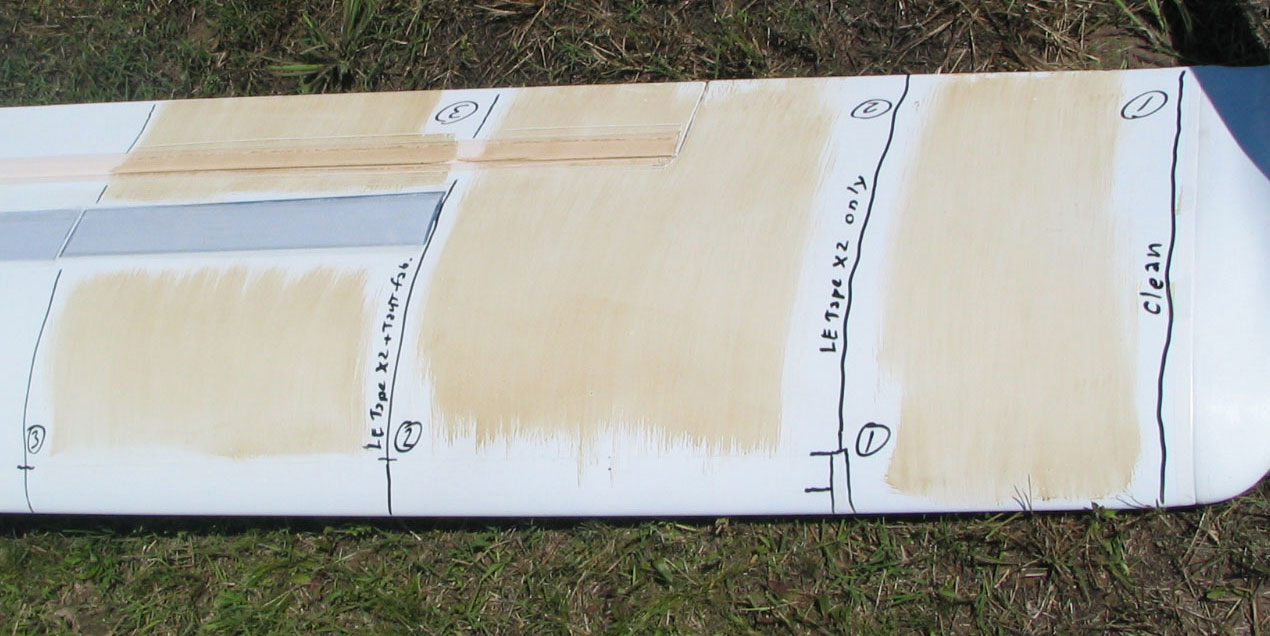
| Sections 4, 5 & 6 - Top Side - Before Flight |

|
|
Top surface of sections 4, 5 and 6 near inboard end of left aileron before flight.
|
| Section 4 - Top Side - After Flight |
|
|
This section in included only to see what happens when the deturbulator membrane is removed, leaving only the bare
substrate exposed to the flow.
Differences in the leading edge tapes divide this section into three regions.
1. The top half of the image has a single strip of 1 7/8" (48 mm) wide tape around the leading edge of the wing with the
top edge positioned at .025 chord.
2. The center of the image has a similar tape positioned at .44 chord. This tape runs to the tip.
3. The bottom of the image has a second tape at .27 chord applied over the .44 chord tape. The purpose of the second
tape is to broaden the effective width of the tape. The edge at .27 chord is not important, but allows the edge on the bottom of the
wing to be farther aft.
Again, we have a beautiful example of a speck of debris tripping the flow and creating a swatch of attached turbulent flow
that streams the oil over the substrate.
|
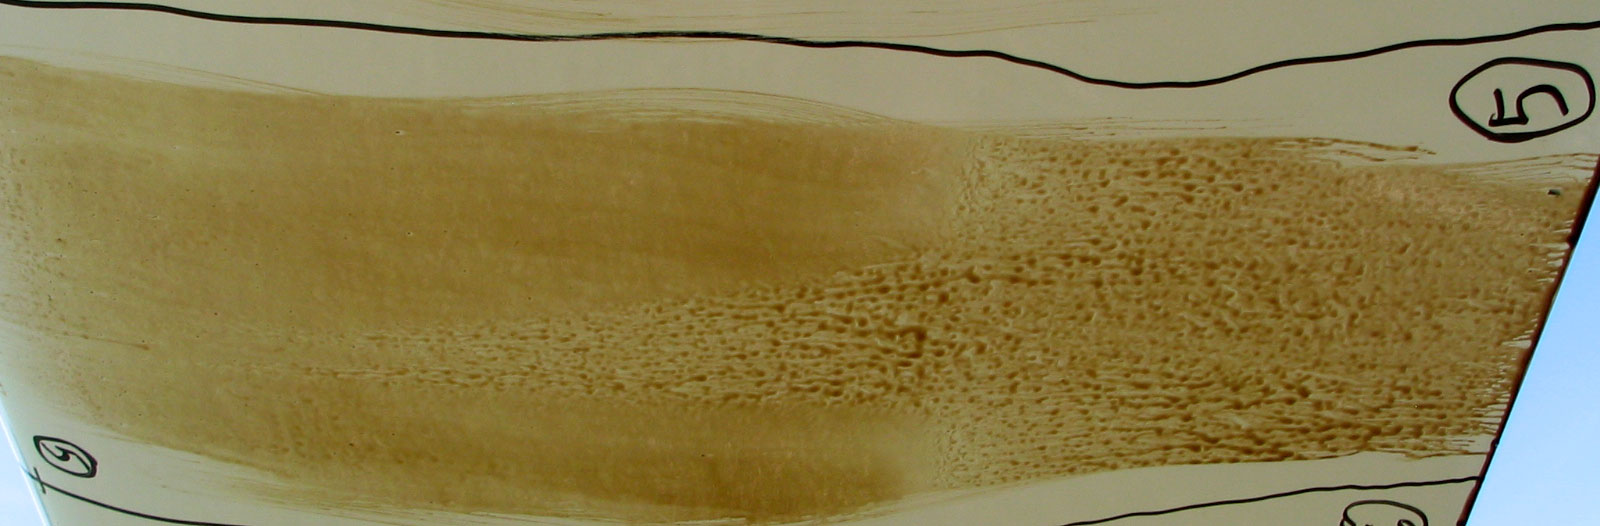
| Section 5 - Top Side - After Flight |

|
|
This section has an experimental membrane material that was appears to have loosened in flight.
The pattern is normal in appearance and clearly indicates that the panel is not working and is
likely adding to the turbulence generated at the reattachment point. It remains a question whether
this material would have worked had it been applied with some tension. In any case, it did not react
well to the solvent I use for removing adhesive and so has a practical limitation. The search of
a better porous membrane material goes on.
|
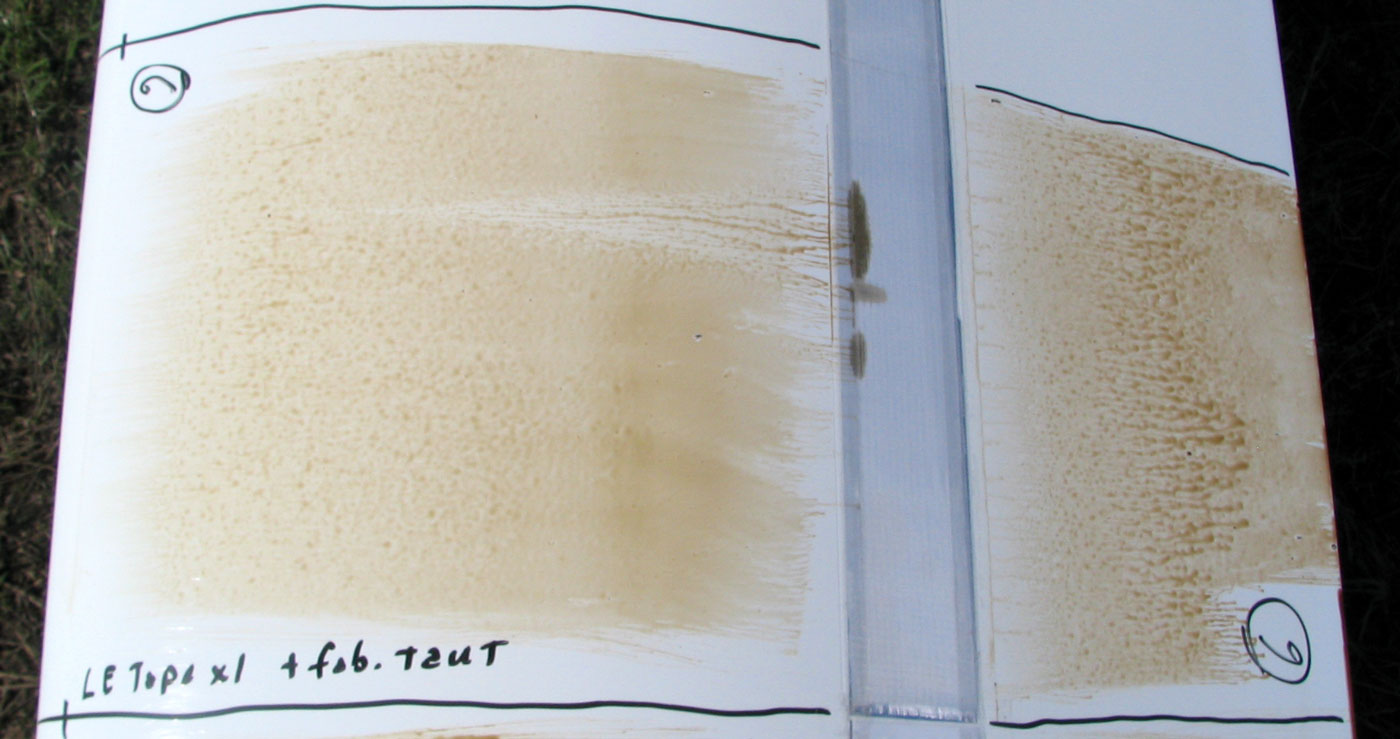
| Section 6 - Top Side - After Flight |
|
|
This is a properly working deturbulated section. I can't say it is working optimally, but it shows all of the features
I look for in deturbulated boundary flows. For contrast, compare it to section 5 above.
The bubble has a soft leading edge where it's gentle forward motion converges with the aft moving detached flow. The
dark region at the front of the bubble is evidence of the reverse flow. Oil tends to collect where it is dragged before
the flow lifts from the surface under the influence of the aft flow. The faintly lighter band ahead of the bubble
may result from the aft flow being lifted farther away from the surface as it approaches the bubble.
Perhaps, the puddles in the dead zone ahead of the light band were piled up by undulations in the marginally detached flow
before it lifts farther away from the surface to flow over the bubble.
Behind the deturbulator, the flow cleans the surface for about half an inch and lifts away again as at the front
of the wing. It forms in little puddles that grow larger and become streams as the flow departs the surface.
The streams end abruptly when the flow is too far from the surface to drag the flow any farther. The flow appears
to be detached from that point to the trailing edge of the wing. Notice that debris in this region does not cause
turbulent streaming. This further evidences detached flow.
|
| Section 4 - Bottom Side - After Flight |
|
|
This section has the leading edge tape marked with dry erase marker near the leading edge. The top surface has only
a deturbulator substrate and shows normal clean wing boundary flow over the top.
There is indication of a gentle, flattened bubble from .4 to .62 chord.
Some debris near the leading edge perturbed the flow and turbulence evolved, gradually at first, into a swath of
attached turbulent flow. Notice the large speck of debris above the swath in the dead zone. Turbulence does not
begin to show up until an inch behind the speck, and even then, it is a thin trail that is slow developing.
Contrast this with the larger turbulent stream. This indicates the height of the separation at .35 chord.
|
| Section 5 - Bottom Side - After Flight |
|
|
This section has leading edge tape. The top surface has a nonfunctional test membrane on the deturbulator panel.
There is indication of a gentle, flattened bubble from .43 to .62 chord.
Some debris near the leading edge perturbed the flow leading to a wide swath of attached turbulent flow.
|
| Section 6 - Bottom Side - After Flight |
|
|
This is the bottom side of the beautifully deturbulated section 6 top surface.
There is indication of a gentle, flattened bubble from .5 to .62 chord.
This bubble begins .1 chord later than section 4 that does not have a functioning deturbulator on the top surface.
However, most likely, the shift in bubble leading edge is due to a gradual linear transition in the airfoil between
the wing root and the inboard end of the aileron.
A piece of debris marred the image with a giant swath of attached turbulent flow, but we can still see
that this section is working well on the under side as well at the top side (above).
Very near the leading edge, the oil tries tom stream but ends abruptly when the flow is too far from the surface to
influence the oil. From about .7 chord to the faint reattachment line, behind the gentle bubble at .6 chord, there is
virtually no evidence of the flow influencing the oil. The slightly darker bubble region does not have a dark
leading edge line and oil remains on the surface along the reattachment line behind the bubble. These features suggest
a flat bubble with grazing angle leading and trailing edges. If the bubble is flat, it's contribution to form drag is
minimal. Transition to attached turbulent flow begins at .66 chord.
|
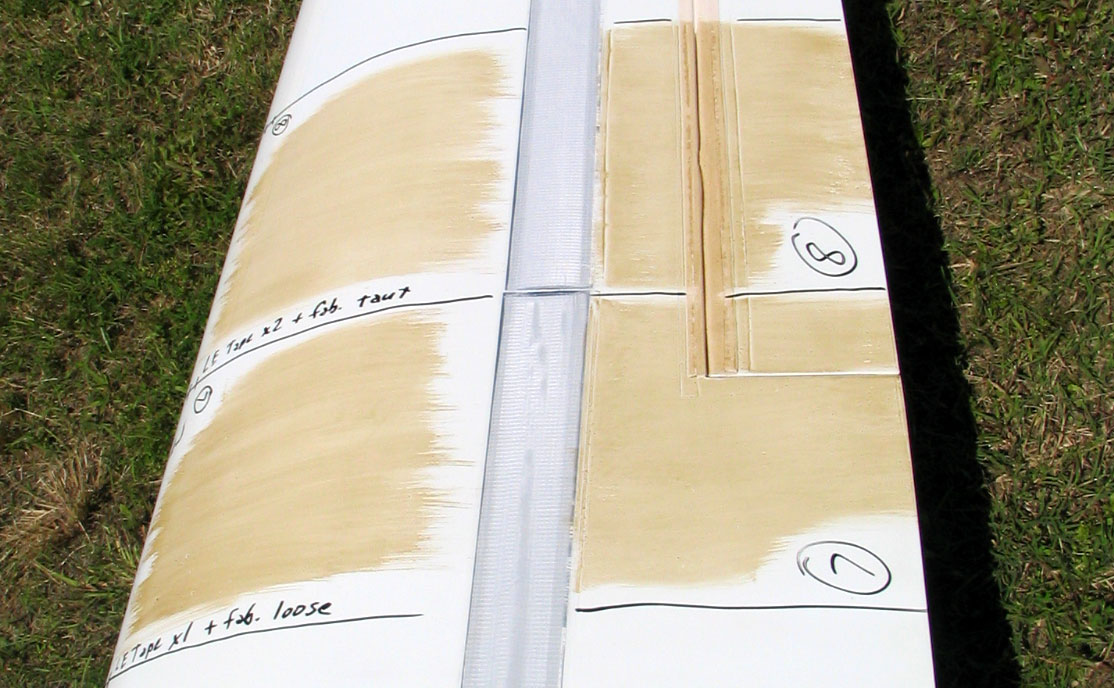
| Sections 7 & 8 - Top Side - Before Flight |
|
|
Top surface of sections 7 and 8 near inboard end of right aileron before flight.
|
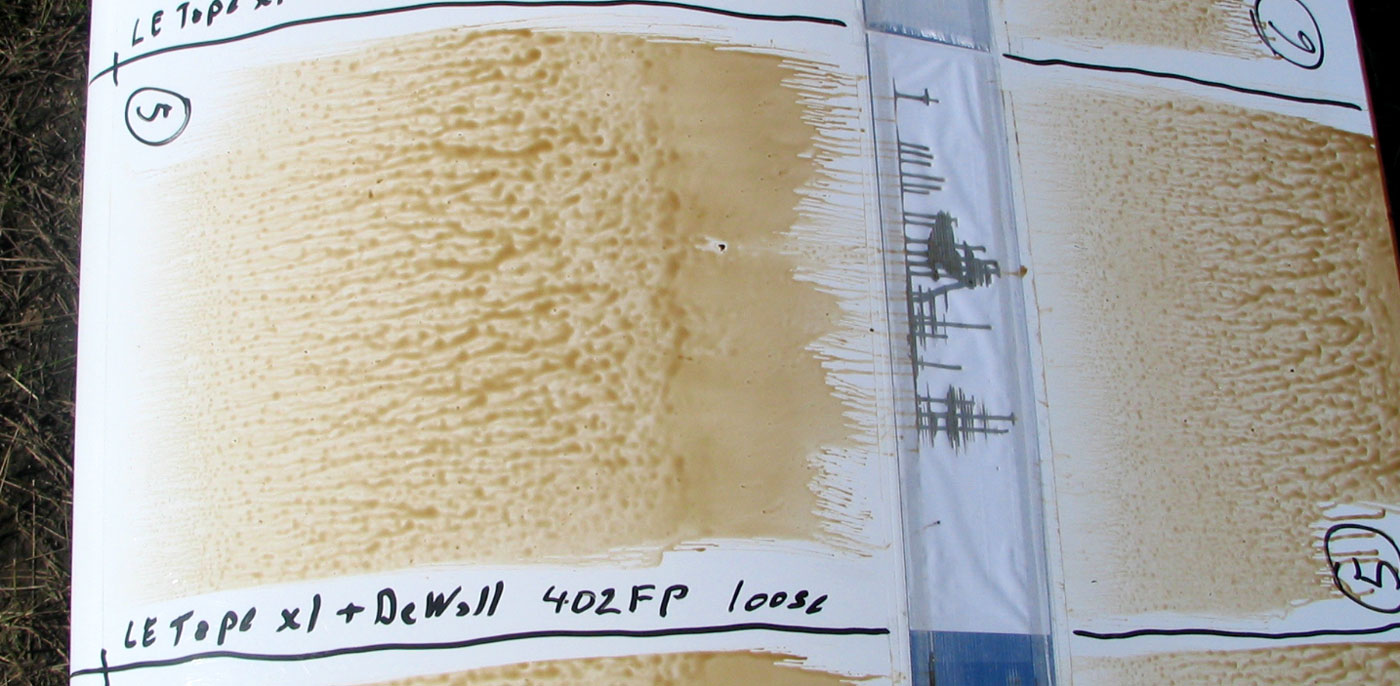
| Section 7 - Top Side - After Flight |
|
|
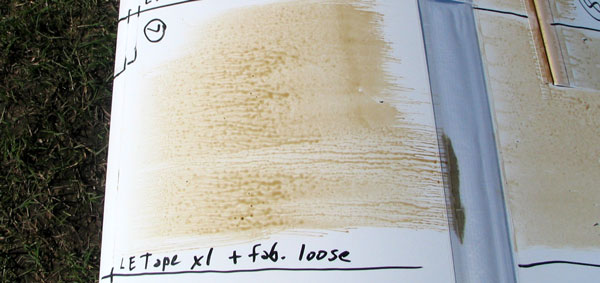
This section has the fabric membrane deliberately applied with excess looseness. The standard leading edge tape is present.
At this point on the wing, if there were laminar attached flow, the oil would have been
scrubbed from the surface so thinly that none could observed. Behind this, there is a narrow band with the usual dappled puddles,
indicating sufficient separation that the oil is not dragged along significantly by the flow above. But, then streaming sets in,
either because the oil drifted aft enough for its thickness to increase to a height where it encountered the flow above or the
bent toward the surface enough to influence the oil. This not mean that high speed flow was low enough to cause friction drag on
the clean surface, only that it was low enough to pull the tops of the thick oil streams. The end of the thick streams about
mid-way through the laminar separation zone indicate that the separation height increased at that point enough to loose contact
with the oil.
the top half of the image shows clear evidence of a reverse circulation bubble that has not flattened as much as we would like to
see. The heavy collection of oil along the convergence line with the aft flow indicates significant reverse flow velocity and
up welling. Presumably, the bubble height contributed significantly to form drag.
Behind the deturbulator panel, there is the usual narrow band of clean surface. Since there was oil in this band originally (see above)
it is clear that flow leaving the deturbulator panel descended and rubbed the surface before separating again within an inch.
At the bottom of the image where turbulence from debris streamed oil onto the front of the fabric, the departing flow seems not to
descend to the surface at all. Behind this narrow band, there appears to be no modification of the oil by the flow at all.
The anti-peal tape extending from the aileron gap seal can be seen tripping the flow. This indicates that the separation at that point
is only marginal. The tape is about 0.003 inches thick.
The debris in this image tells a story too. The large specks at the bottom of the image and the smaller ones farther up
in the dead zone had no influence on the flow at all. This shows that the flow was far enough above the surface to avoid
being influenced by the debris. However something at/on or the leading edge tape itself may have a 3D irregularity that is too
small to show up in the image. Yet, it induces a turbulent stream. This indicates contact of the high speed flow with the
obstacle and the thinness of the boundary layer at that point.
In summary, it looks like this section has both good and bad indications. Ahead of the bubble, all is well and the early detachment
should have resulted in a reduction in skin friction. Behind the deturbulator
there is marginal separation resulting in a decrease in skin friction where turbulent attached flow would have been.
However, the bubble height may not have been reduced as much as possible if at all, so the form drag on the top surface may not have
been improved much or at all.
|
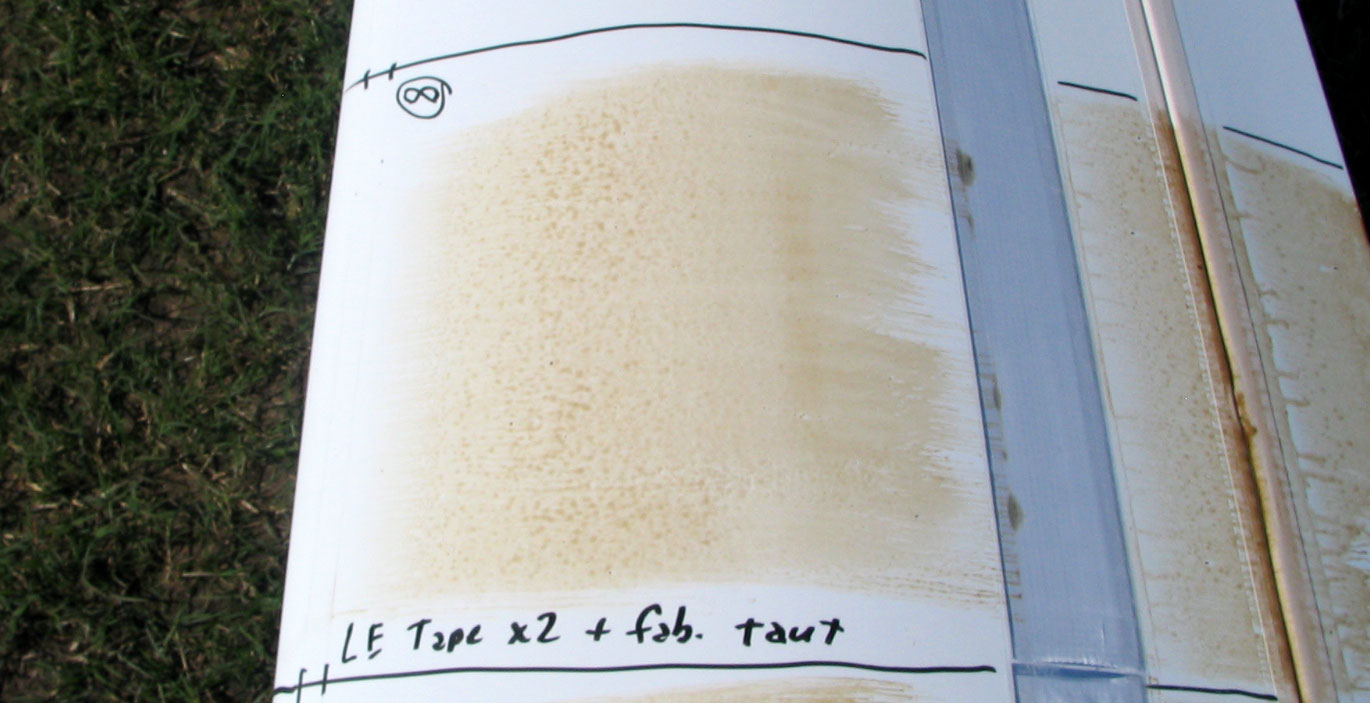
| Section 8 - Top Side - After Flight |
|
|
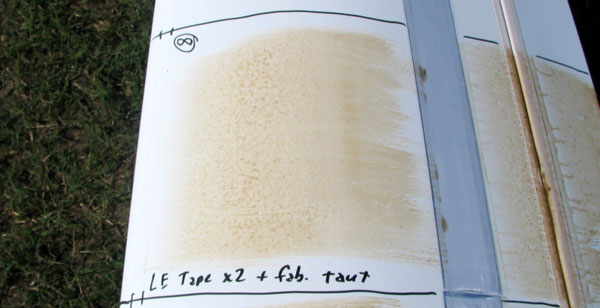
This section is like section 7 above except that the fabric has enough tension to lay flat on the ridges of the
substrate without wrinkles. This section shows all the characteristics of section 6 above. It worked very well.
The difference is that this section is on the outer wing panel and was disrupted by the aileron gap tape that
was too thick and disrupted the flow more than the open gap would have. Another configuration difference is that
this airfoil shape differs from the one at section 6 and the chord length is less so two leading edge tapes are
used to make the tape effectively wider.
This is the ideal flow pattern that I think results in large performance improvements. Skin friction is broken over
most of the area ahead of the deturbulator. Behind the deturbulator,
had the gap seal tape been removed, there would be no skin friction except around the leading edge of the aileron itself.
I know that from earlier oil-flow images without the gap seal tape.
|
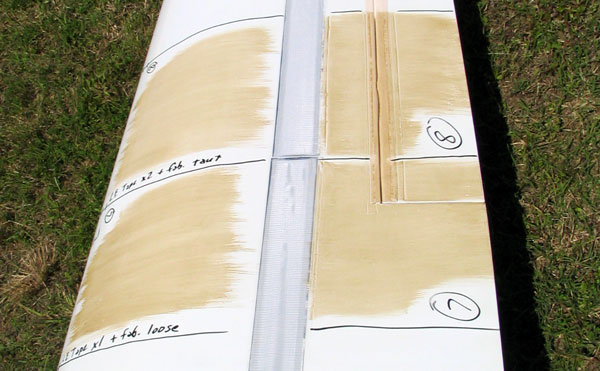
| Sections 7 & 8 - Bottom Side - Before Flight |
|
|
Bottom surface of sections 7 and 8 near inboard end of right aileron before flight.
|
| Section 7 - Bottom Side - After Flight |
|
|
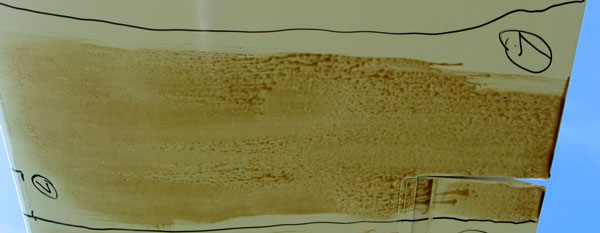
This is not a very good section because of contamination causing large areas of attached turbulent flow.
Other parts of the image, however, are working well and there is no indication of a bubble
to speak of. Instead, in the bubble region we can see an interruption of the turbulent flow at the top of the image,
but no sign of lifting ahead of the "bubble" nor cleaning of the surface at the reattachment point behind.
These features suggest a very thin bubble which is a beneficial feature since it reduces skin friction without adding
appreciably to the form drag.
|
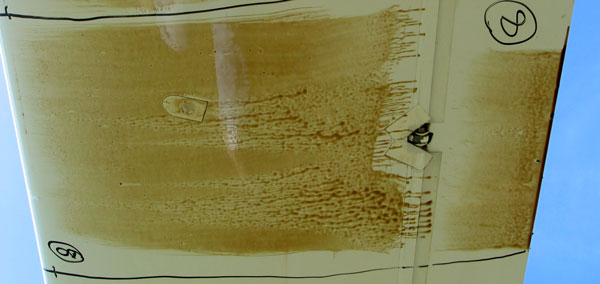
| Section 8 - Bottom Side - After Flight |
|
|
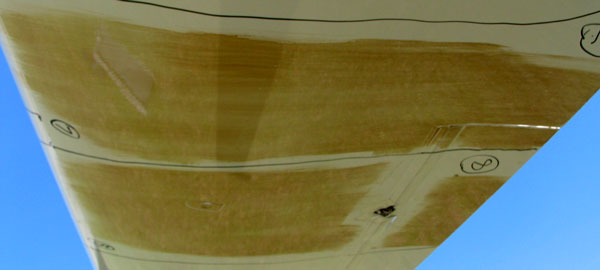
This section, is much like section 7 above, except the tie down hole is covered with tape that trips the flow.
The aileron control knuckle is back at a place where the flow is already turbulent.
The wide turbulent swath at the bottom begins from a flaw in the tape that can be seen clearly. Just above that,
a large speck of debris is tall enough to disturb the flow above enough to degenerate into a turbulent stream about
an inch later. Three other debris specks at the top of the image in the "bubble" region indicate virtually no flow
there at all.
The large clean area behind the aileron seal is because the oil was not painted close to the seal. This was to prevent
oil from getting under the seal with downward aileron deflections.
|
Jim Hendrix
Oxford Aero Equipment
|