|
|
|
||
|
(Revised 10/21/2011)
Aaron Kiley and Tom Shipp fly Standard Cirrus #70 (N8559) from KADG in Adrian Michigan. They have graciously volunteered to contribute to the Deturbulator Project by taking measurements with their glider to corroborate and/or help investigate the leading-edge deturbulator tape phenomenon. Their work is appreciated, as it is speeding up the pace greatly. It should be noted that they acquired very good baseline measurements on their second flight, taking three data sets. This validates the idea that even inexperienced pilots can measure their own glider's performance using their IGC logger. They only need the ability to select good weather conditions and to hold an airspeed precisely. This method is documented in Sink-Rate Flight Testing With Your Flight Data Recorder (PDF). Also, Parallel-Flight Testing With Your Flight Data Recorder (PDF) describes how to measure performance by flying parallel with a reference glider.
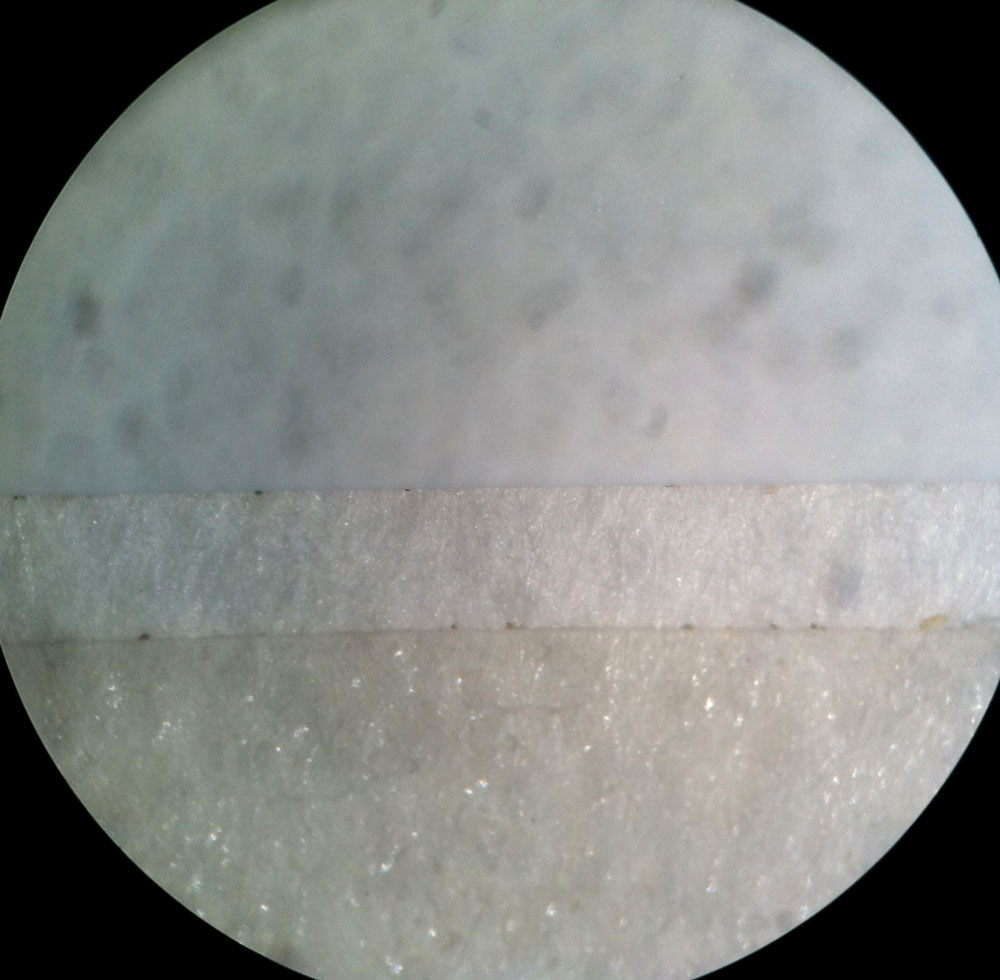
First Sink-Rate Measurements Since they did not have a roll of 12mm (.472") wide tape, they cut a roll of 1" wide tape in half using a rip saw. This sounds crazy, but the results were better than you would think. Fig. 1 shows the cut edge. It was not straight, but neither is it ragged. One rough spot in the photo looks like it would trip the flow. Evidently, there were not too many of them.
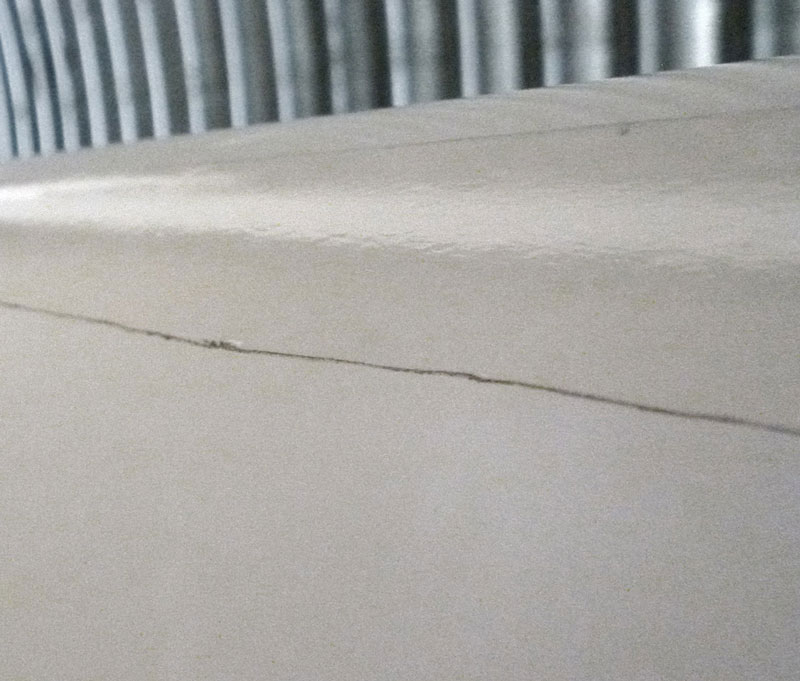
Figure 1. Cut Edge of Tape
The clean wing (baseline) and taped (modified) data were averaged over the two measurements and plotted (Fig. 2 below). The 50 kt baseline point was out of line and was discarded. An artificial point that fit reasonably with the other three points was substituted and graphed with an X. Since this point was not measured, the 50 kt performance change should be taken with a grain of salt.
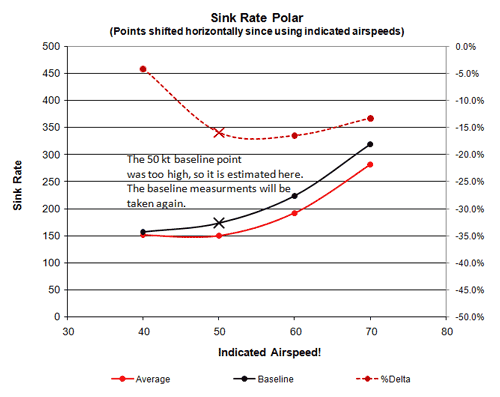
Figure 2. First Day of Measurements
Since they do not have a calibration of their airspeed system (Pitot/static and instrument), their results are plotted vs. indicated airspeeds. This means that there are horizontal errors in the placement of their points and that means that L/D calculations (speed/sinkrate) would be erroneous, so they are not shown. The differences between modified and baseline were about as expected compared to my own prior measurements on Standard Cirus #60, QZ in Fig. 3 below. In that graph, QZ's baseline (black) was measured by Dick Johnson in 2006 after calibrating the airspeed system. The purple curve is the first set of sink-rates taken on QZ with the 12mm wide Tesa 4104 White tape (3/19/2011) The dark red curve, from 65 to 90 kts, is from a prior measurement of QZ on 1/29/2011 with tape that ran from the leading edge downward to about the same point as the rear edge of the 12mm tape. That tape was .0003" (7.6um) thicker than the Tesa 4104 tape and, from the inboard end of the aileron toward the wing tip, it angled back more than the 12mm tape. The red curve is an average of the those two QZ measurements.
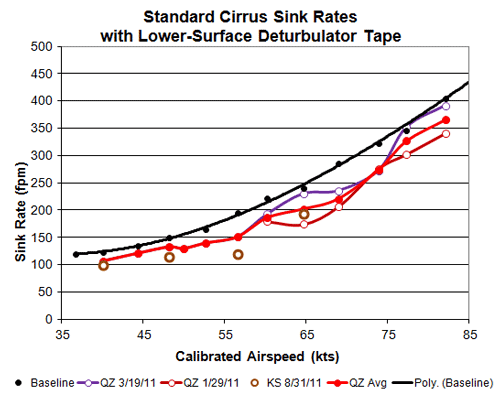
Figure 3. The First Kiley-Shipp (KS) Measurements Compared to Prior Measurements on QZ
The brown circles are the averages of two points taken by Kiley and Shipp (KS) in their first test flight (8/31/2011). They are shown here to get a rough idea of how they compare to my own earlier measurements on QZ. Since there is no calibration of their airspeed system, I assumed that their Pitot/static system was about like the one on QZ. Instrument calibratoin errors were ignored. To get the displacement from QZ's baseline, the change from KS's baseline was used. The modified KS sink-rate differences were close to prior measurements on QZ at 40, 50 and 70 kts. 60 kts showed a much lower sink rate. Also, recall that the KS 50 kt point is not very good since I corrected a bad baseline measurement with a value that fit with the other three points. In any case, the first KS measurements show general agreement with earlier data from QZ. The troubling thing about these first measurements was that their baseline sink rates were too high compared to QZ. This is shown in the brown curve in Fig. 4 below. Was their ship really that bad or were the measurements off? A second baseline measurement on 10/4/2011 (blue) corrected the difference making it clear that all the sink rates measured on 8/31/2011 were inflated. Since those consisted of measurements at high altitude and low, it appears that there was a large air mass subsidance that day. This also appears to have affected the modified measurements in the second flight of the same day (Fig. 2 above), making the relative differences (improvements) meaningful.
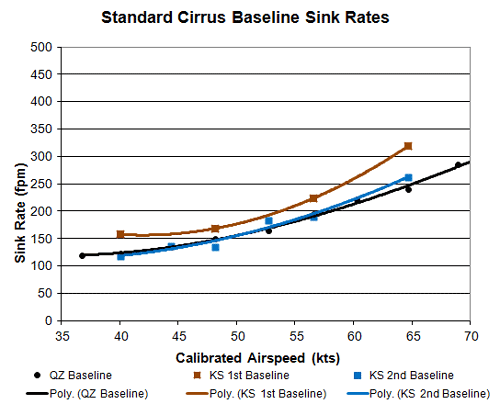
Figure 4. KS and QZ Baseline Sink Rates
After the first day of testing (8/31/2011), Aaron and Tom removed the tape they had cut down to 1/2" width, waxed the wings and proceeded to retake the measurements, this time using the 12mm wide 4104 white tape and taking data in 5kt steps. The result of those measurements (10/4/2011) is shown in Fig. 5 below.
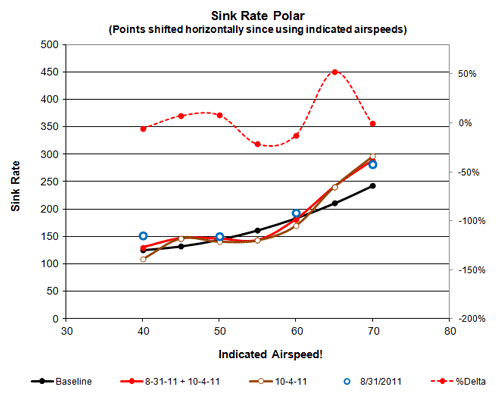
Figure 5. Second Day of Measurements
The first (8/31/2011) taped measurements (blue circles) indicated no improvement over the second (10/4/2011), accurate baseline measurements at 50 and 60 kts and losses at 40 and 70 kts. That could be seen as arguing that the original un-waxed wing surfaces also failed. But, it can also mean that the same subsiding air mass that gave high baseline sink rates on 8/31/2011 also gave high modified sink rates, since they were both taken on the same day, and that there was actually improved performance that can be seen in Fig. 2 versus a similarly affected baseline. It is disappointing to see in Fig. 5 that the 12mm tape mod actually harmed performance. There is something wrong here and the question is what? Four possibilities come to mind:
Prior Measurements (Fig. 3) are Entirely Bogus
Tape Edges
Tape Thickness
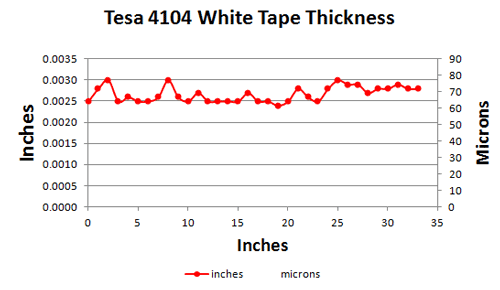
Figure 6. Tesa 4104 White Tape Thickness Variations
Tape Position
One issue we are investigating is the role surface properties of the tape and the wing may play in making the tape work. As mentioned above, the clear Test 4104 tape has a textured surface (Fig. 6 above)compared to the white variant that has a glossy smooth surface. Since flying my glider with clear tape on one wing and white on the other produced a strong tendancy to yaw/bank toward the clear tape, it appears that this is a real issue, although more testing is needed.
Another question is, "What is the role of aerodynamic friction on the wing surface behind the tape?"
It seems obvious that greater surface friction there, would assist the formation and maintenance of rolling vortices
by holding back the bottom of the vortices. Wax on a surface reduces the tactile surface friction, possibly impeding the tape effect.
To find out if there is anything to this theory, Tom and Aaron have removed wax from the forward 50% of the lower surface of their
wings and taken another set of measurements that are shown in Fig. 8 below.
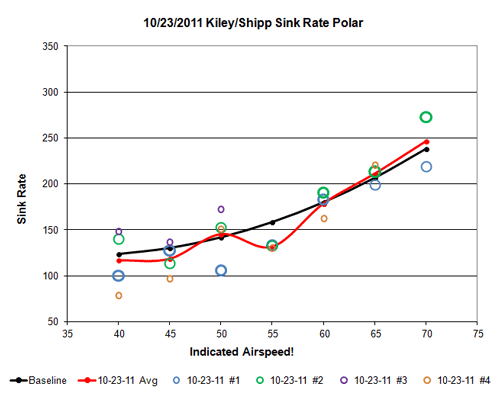
Figure 8. Sink Rates without Wax Removed on the forward 50% of the Lower Surface of Wings
There is a lot of scatter between the readings. Five points are much farther from the average than Dick Johnson normally got (20 fpm at most from the average) using his manual notation method of taking data. Except for one moment in the flight, the air was smooth, so there must have been some shear waves present. Averaging 3-4 measurements at each speed seems to have taken care of most of the scatter fairly well. Nevertheless, the averaged values must be understood to have a fairly wide margin of error. It is noteworthy that all three 55 kt points fall on top of each other. That's quite a coincidence, since none of the other six speeds were so lucky. But that is the way it is and three points in agreement pretty well establishes a 15% sink rate reduction at 55 kts, which agrees with my prior measurements (Fig. 3 above). Now the question is "Why are the remaining points, with the possible exception of 45 kts, all showing baseline performance?" Since the point of these measurements was to assess changes after removing wax from the wing surface, the prior two Kiley-Shipp data sets (8/31/2011 and 10/4/2011) are plotted with the 11/23/2011 data below in Fig. 9.
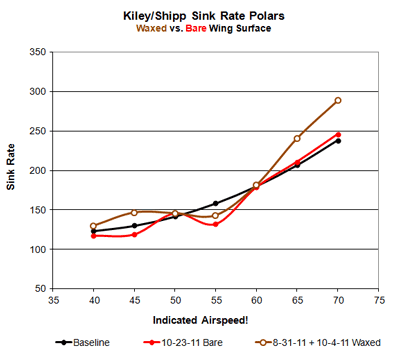
Figure 9. Comparison of Waxed and Bare Wing Lower Surface
There are between four and six measurements averaged into each of the brown measurements showing sink rates before removing wax from the forward 50% of the under side of the wings. Notice that there is a severe high speed (over 60 kts) loss. We can assume that the tape was tripping the flow at high speeds when the boundary layer becomes thinner compared to the tape thickness. I have not seen this in my measurements (Fig. 3 above). However, this is gone in the 11/23/2011 measurements after removing the wax. Was changed wing surface friction behind the tape responsible for this? Or, was there something different about the last installation of the 12 mm wide, white Tesa 4104 tape after removing the wax? Or, is there an atmospheric issue in play here, such as humidity level? The point was to see if removing the wing surface wax made a difference. There is a large difference, but is that what it can be attributed to? Next, notice athat the 50, 55 and 60 kt points are grouped together for all three flights. Evidently, those measurements are reliable. They show a consistent improvement at 55 kts and baseline performance at 50 and 60 kts. Furthermore, the bare (no wax) performance almost doubled the improvement at 55 kts, bringing it to the levels I have measured, about 15% reduced sink rate. Removing the wax may have eliminated the high speed losses and improved on the 55 kt performance.
Atmospheric Conditions |


| © Copyright 2003-2012 Jim Hendrix | Disclaimer |