|
|
|
|||||||
|
Since 2003 I have taken numerous drag and performance measurements on Standard Cirrus glider #60 with various deturbulator configurations. Also, I have done a great deal of soaring with deturbulated wings. In addition, independent performance measurements were taken by the legendary Richard H. "Dick" Johnson in December 2006 (see A Fight Test Evaluation Of The Sinha Wing Performance Enhancing Deturbulators). Altogether, these efforts have produced a large body of evidence for performance improvements using the deturbulator flow-control method. Much has been learned about the potential benefits, but much research and engineering remains to be done. Deturbulator Research is committed to encouraging and assisting the efforts of others to understand and use deturbulation methods.
Deturbulator Components
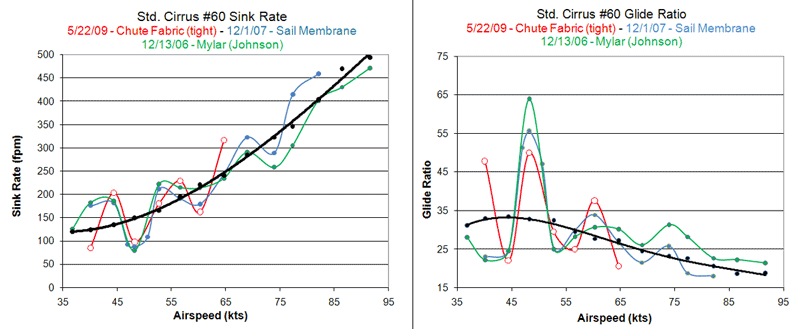
Performance with Full Configuration The Johnson measurements in 2006 assumed consistent performance. So, Johnson averaged all six of his deturbulated flights and reported a 13% improvement at 50 kts. But, upon examining the individual flights, he found huge deviations (4-5 times normal) and decided to throw out the three worst offenders. This lead to an 18% improvement at 50 kts. However, a close look at the six flights revealed non-random patterns. Furthermore, an onboard flight data recorder made it possible to corroborate his manually acquired data and to identify a few errors that made two of his individual polars appear completely unreasonable. Figures 1-3 below illustrate some selected polars with repeating patterns indicating that the large deviations are indeed real.
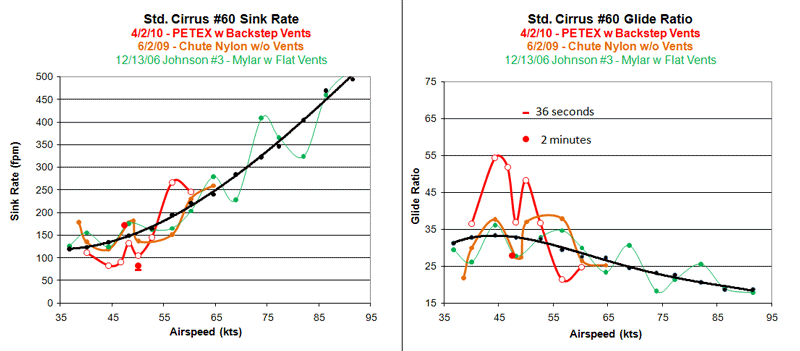
Figure 1 shows three individual measurements of a "peaked" polar pattern in which performance reaches a high peak at 50 knots indicated air speed (KIAS) and degrades on each side. Two secondary peaks occur at higher speeds. This is the typical polar when the deturbulator panel skins are free to move without restriction and properly ventilated.
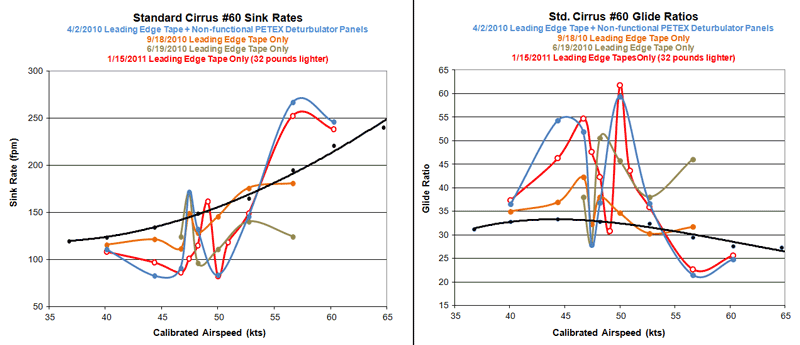
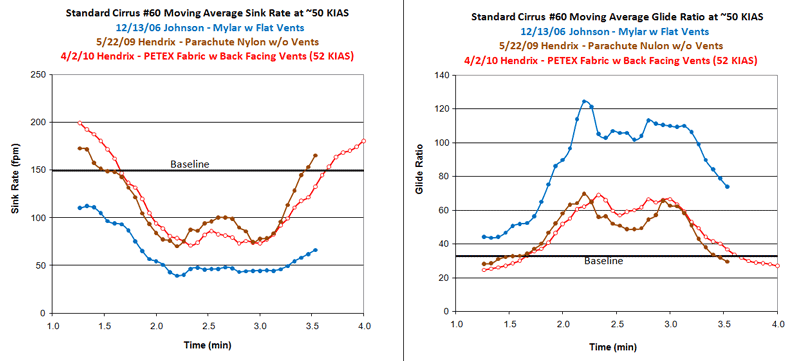
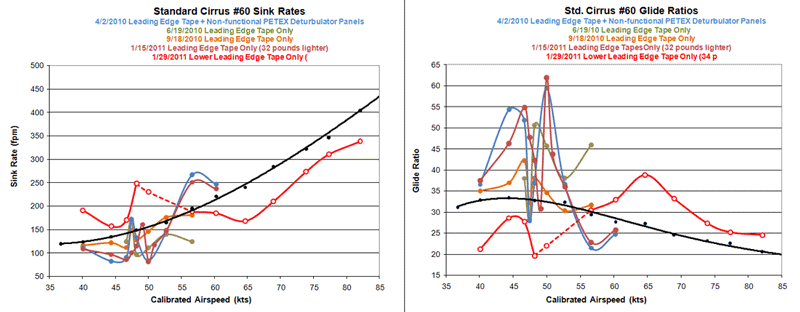
Figure 2 shows four measurements of a "notched" pattern in which performance bottoms out to a consistent value near 50 KIAS and improves considerably on each side. This is a consistent pattern when the deturbulator panel skins are stuck down by condensation, are too tight or the panels are removed entirely. This has been confirmed by measuring the performance with the deturbulator panels removed, but leaving the deturbulator tapes in place. The steepness of the notch is amazing, especially on the low speed side where a one knot difference takes the performance from 28:1 to over 50:1. On the high speed side, the slope is not as steep. The 48 and 52 KIAS performance airspeeds are very hard to hold. The glider wants to slide away from them and tends to seek the notch. For more on these measurements see Leading-Edge-Tape-Only Performance Measurements. These two patterns, peaked and notched, were first seen in December, 2006 when Richard H. "Dick" Johnson independently took measurements. (Read his report: A Fight Test Evaluation Of The Sinha Wing Performance Enhancing Deturbulators.) Figure 3 shows another repeating pattern, the trend over time of performance, with deturbulator tapes and panels installed and the panels working, while holding the airspeed constnt at on 50 KIAS. This is a 36 second moving average of performance plotted in 4 second intervals. These plots indicate that, with the onset of extreme performance, the lift coefficient tries to increase but cannot since the pilot is holding the airspeed constant. This pitches the nose down, to keep the lift equal to the weight of the glider. With the reduced AOA and ideal flow configuration, induced, skin friction and form drag are reduced for a high level of performance. However, the reduced AOA changes the top surface flow trajectory so that the reattachment point shifts away from the deturbulator panel. The lift coefficient then tries to reduce. So, the nose pitches up again to keep the lift equal to the weight. This causes the performance to subside. It is thought that this cycle will repeat every 4 or 5 minutes if the pilot can hold the airspeed precisely constant.
Changing Flight Dynamics at Onset of Extreme Performance
Deturbulator Construction
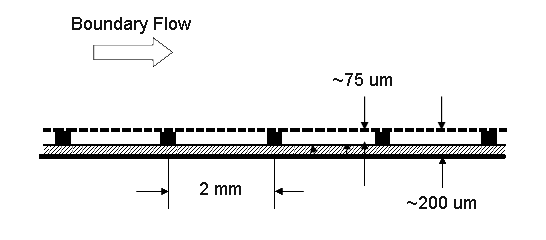
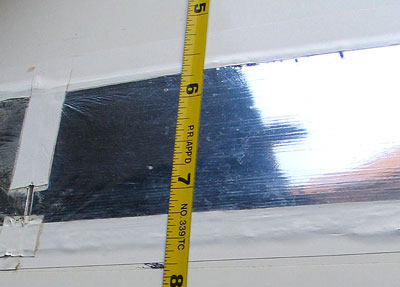
To date, substrates have been made from 2 inch wide aluminum tape. Lengths of this tape are passed through rollers that impress the grooves into the surface. The latest material that I have been using for skins is a polyester (polyethylene terephthalate) mesh called PETEX, that is produced by Sefar AG and can be obtained from Small Parts, Inc. This mesh is woven from 34 um threads and has 1% open area. The porosity serves mainly to allow evaporation of condensed humidity under the skin which would replace air in the ridges and cause the skin to become immobile. Dr. Sinha will provide substrates to seriously investigators. The only other materials needed are various tapes that are commonly available. The jury is still out on whether or not the PETEX mesh actually works. This is because the measurements so far give a notched polar resembling the performance when removing the deturbulator panels all together and leaving the leading edge tapes in place. This, however, may be due to the vent design that may suck the skins down too tightly.
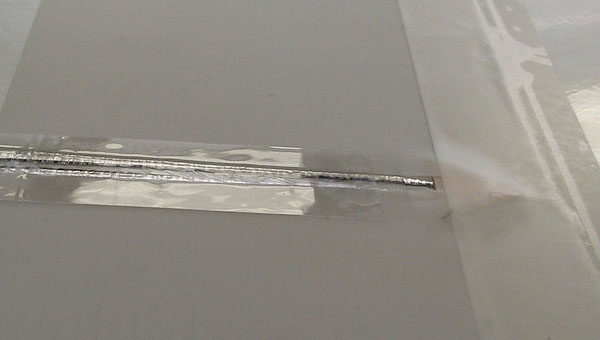
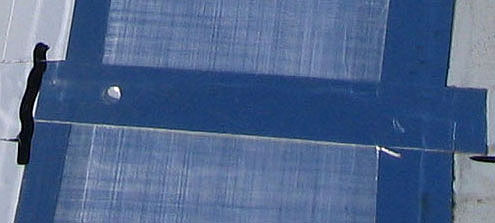
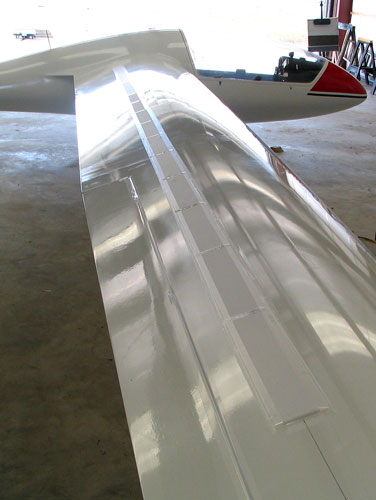
Deturbulator Installation Ideally, there should be a perfectly smooth transition from the wing surface to the deturbulator skin. However, reality being what it is, we must shoot for the thinnest and smoothest possible transition. For attaching the skins, I use thin 1/2 inch Scotch Permanent Double Sided Tape. I place it on the wing surface abutting both edges of the substrate. The skins are cut 2 3/4 inches wide, allowing 3/8 inch overlap onto the double sided tapes. The skins are placed flat over the substrates without tension. If the boundary flow is to interact with rows of trapped air beneath the skins, it is critical to have the skins lying in contact with the ridges but not tensioned. It appears that the skins work better loose rather than tight. Too tight skins appear to reduce the performance and also produce the notched polar pattern seen in Figure 2. PETEX mesh was chosen largely because of it's dimensional stability with changes in temperature and humidity. It may be best to install the skins a little loose and then rely on the ventilation system to maintain proper contact with the substrate ridges. In any case, vents are needed to keep the skins on the top surface of the wing from ballooning up and to deal with static pressure variations from altitude changes. Discrete vent holes between the panels operate more efficiently exhausting air than admitting it, since with increasing static pressure, the skins press down between the substrate ridges and restrict flow. This leads to a spanwise variation in skin tightness and, presumably, a spanwise variation in deturbulator function. Next, you will need to join the panel skins in a way that provides appropriate ventilation. More will be said about this critical issue later. I apply a short strip of double sided tape into the substrate joint to hold down the skin at the joint. But, depending on the vent design, I leave a place near the leading edge (where the pressure in the adverse pressure gradient is lower) open to allow air movement in and out. Figure 5 shows a rear-facing vent design that I think produces too much suction and so causes the notch pattern in Figure 2. Also, it introduces a speed dependency that may affect high-speed performance.
The last step is applying a thin single sided tape over the leading and trailing edges of the skins. This holds the top side of the skins, covers the exposed double sided tape and smooths the transition from the wing surface to the skins. For this, I prefer 3/4 inch Scotch Gift Wrapping Tape. Ordinary transparent tape works too, but Gift Wrapping Tape is easier to remove. Do not use Scotch Magic Tape (invisible) because it is almost impossible to remove in one piece. I have taken oil-flow images that show the flow tripping at the leading edge of deturbulators that were too thick and had a sharp leading edge step. As a precaution you might smooth the leading edge of the covering tape with paste wax or something else that will not harm the wing surface.
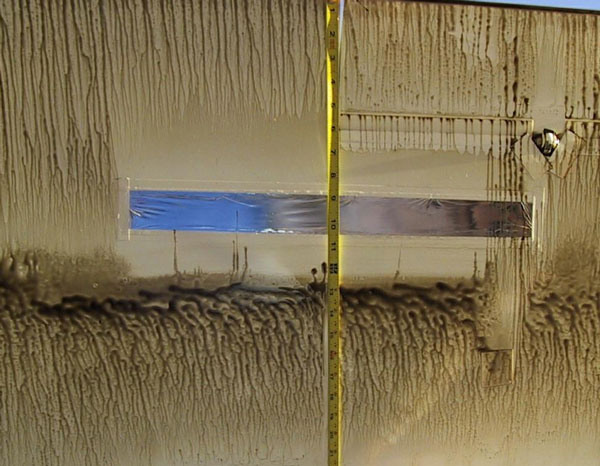
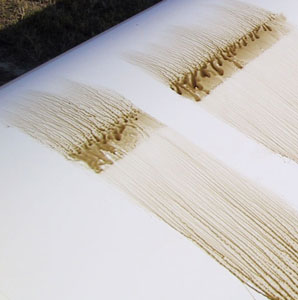
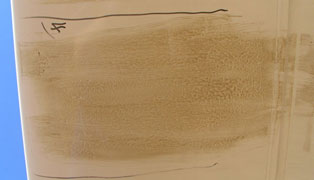
Basic Deturbulator Operation First, notice the normal flow pattern on the left side of the image. The flow direction is from bottom to top. At the bottom, you can see a thickening of the oil streams as the flow moves toward the bubble area. This is where the laminar flow separates from the surface, reaching its highest point over the circulating bubble that traps the line of oil that is clearly evident. On this wing, the bubble on the lower surface moves fore and aft with small changes in airspeed. This blurs the bubble edges, but the bubble can be seen anyway. The most important feature to notice on the left side is the light line at the rear of the bubble. This is where the flow strikes the surface at a fairly steep angle and the violent force wipes the surface almost clean. Behind that line, the flow becomes turbulent over a short distance, as can be seen by the thickening streams. This is the place where we wish to modify the transition to turbulent flow.
In the middle of the image you see a silver deturbulator panel. This panel has an aluminized Mylar film membrane. The striking thing about this image is the way the panel causes the surface ahead and behind to be wiped clean. This is definitely not the kind of behavior an ordinary piece of tape would produce. The surface looks like the leading edge of the wing (lower right corner of the image) where laminar flow wipes the oil away. It is interesting to note that the flow ahead of the panel is modified, even encroaching on the bubble. Another point to note is that the attached turbulent flow leaving the wing behind the panel leaves oil streams that are noticeably thinner than the unmodified streams on the left side of the panel. This indicates that the boundary layer is not as thick behind the panel. Now, what happens when fully turbulent attached flow strikes the panel. The image shows an example of this too. A patch of thick tape was used to cover a tie-down attachment hole. We can see that this is tripping the flow at its leading edge. This kills the bubble, since the flow is already turbulent and attached to the surface. The streams following the patch indicate turbulent flow approaching the deturbulator panel. It is plain that in this region, the panel is inoperative. In fact, the thick streams leaving the panel indicate a thicker turbulent boundary layer. The panel is enlarging the turbulent boundary layer. Now notice that the aileron gap seal behind the deturbulator panel is tripping the flow. This can be seen from the streams initiating at the leading edge of the seal. I take this as evidence that the regions of cleaned surface surrounding the deturbulator panel do indeed indicate laminar attached flow. One final note, this instance is not illustrative of a panel on the top surface operating in a mode that produces large performance increases. It only shows that deturbulator panels, located in the reattachment zone, may in fact function dynamically to modify the transition to turbulent flow. At the beginning of this project, drag reductions were easily achieved on the lower surface. I recommend that other researchers begin in this way for early evidence of deturbulator performance. Top surface results are much more difficult to achieve.
Ventilation Ports
Leading-Edge Tapes
Bottom Surface Installation
Top Surface Installations
Pure Mylar We used the same configuration when we began deturbulating the upper surface, but quickly found that venting was needed to pull the skins down into contact with the subrtrate ridges. For this we left an open gap between the panels near the leading edge where the pressure over the panels is lowest. This worked to pull excessive air out from beneath the skins. Figure 8 shows a typical vent used for the Johnson Flight Tests (12/2006). It was crude, but worked well.
This configuration produced the green curves in Figures 1. However, it had a persistant problem with condensation that limited flow-surface interaction modes.
Reinforced Mylar After the Johnson tests, we had to install a new set of deturbulators for further testing. After two failures, we installed a set using fiber reinforced Mylar, a material made for racing yacht sails. Figure 9 illustrates a vent hole punched in the aluminum tape joining two of these panels.
Aluminum tape was used to attach the skins directly to the substrate edges. This made a uniformly flat joint, but the step height from two layers of aluminum tape was too square and too high so that it tripped the flow before reaching the skins. The solution was to smooth the sharp leading edge with thin tape. After that, this configuration produced the blue curve in Figure 1, which replicated Johnson's third flight, green in Fig. 1. This was the first confirmation that Johnson's measurement was real. This configuration, however did nothing for the humidity problem, so it often failed because the skins were stuck down with condensation.
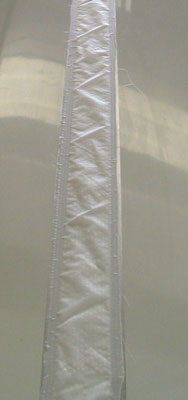
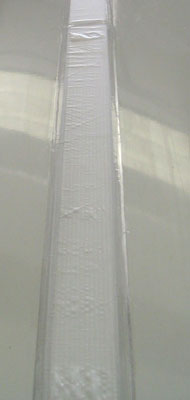
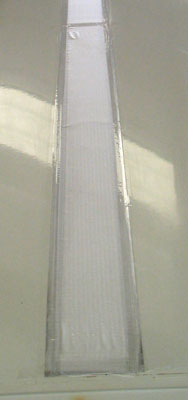
Parachute Nylon To eliminate the condensation problem, I began testing porous membranes. The idea was to allow water vapor to pass directly through the skins so that the humidity level would quickly equalize between the flow and the air under the membrane. Condensation would have an extremely short evaporation path to the outside. Rather than trying to keep moisture out, this method allows it to freely communicate through the skin. I also thought that the pores would constitute a distributed ventilation system. It now appears that a non-uniform porosity pattern with greater porosity near the leading edge is needed for this. For my first tests, I chose Nylon parachute fabric with a weight of 1.2 oz/yd2. It was installed without vent holes. Unfortunately, Nylon is not dimensionally stable enough for consistent results. Figures 11, 12 and 13 show the Nylon before two flights on 5/22/2009 and afterward. The red curve in Figure 1 above shows the performance measured on the 2nd flight. It produced the 3rd instance of a peaked pattern at 50 KIAS.
On 6/2/2009, a second measurement produced the second notched pattern at 50 KIAS. On that occasion, the Nylon was tight before launching and very tight upon landing. The difference in skin tension for these two measurements suggests that little or no tension produces a peaked pattern, while taut skins produce a notched pattern. This is consistent with two measurements by Dick Johnson in 2006. Recent measurements with the deturbulator panels removed and the leading edge tapes in place also produced the notched polar pattern. This coroberates the idea that notched patterns are produced by inoperative deturbulator panels while peaked patterns are produced by functional panels.
Polyester Mesh To achieve better dimensional stability, I installed polyester mesh skins. For this, I chose a mesh woven from 34 um threads with 1% open area. This mesh is 80 um thick with a mass density of 1.9 g/m^2. This material is manufactured by Sefar and goes by the name PETEX. As expected, this material exhibited no visible dimensional change with large changes in temperature and humidity. Also, water trapped beneath the mesh skin evaporated rapidly with air blowing over it. On 4/2/2010, I took sink-rate measurements with the PETEX deturbulators. The results are shown in Figure 15 along with prior measurements also showing a notched at 50 KIAS.
The red curves show the PETEX data. After initially taking data over a range of speeds, I took the 52 KIAS point a second time, holding the speed for four minutes. During that time, the performance started out low, increased, leveled off and fell off after about 1.2 minutes. Figure 3 shows this performance trend along with two prior measurements that yielded the same performance sequence. Figure 15 shows a point (dash) above the Glide Ratio curve representing the best 36 seconds of the four minute 52 KIAS speed run. Also, a point (disk) representing a two minute average of the highest performance section of the four minute 52 KIAS speed run. In addition, I took data at 49 KIAS. This point appears below the Glide Ratio curve and indicates the true bottom of the performance notch. The reason that the blue curve in Figure 2 for the same date (4/2/10) appears different is that the two minute average measurement was used for 52 KIAS and the 49 KIAS point was included. That gives the best indication of the measurements on 4/2/10. The notched polar pattern suggests that, for this measurement, the deturbulator panels were not working. The reason, I believe, was the choice to fit the vents with a rear-facing step that produced a low pressure zone at the vent opening that pulled the skins down too tightly onto the substrates.
Deturbulator-Tape-Only Installations
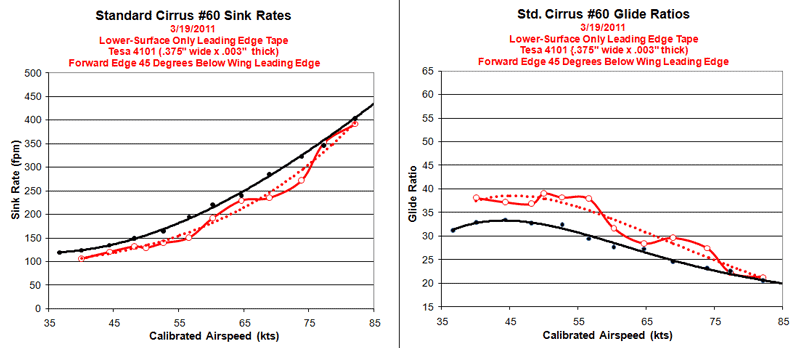
To see the effect of the lower surface tape alone, I removed the upper half of the leading edge tape. That left the original tape in place from the nose of the wing downward. This configuration produced a great surprise. I thought the notch would disappear and the polar would have a nearly normal shape, but this did not occur. Instead, I got the red curve in Figure 17 below: The great surprise was the large loss at all airspeeds below 60 kts (incicated). I realized immediately that this crossover point corresponded to the zero AOA point and the for all lower speeds the the flow above the stagnation point was seeing the forward edge of the tape as a step up. The question was whether this was tripping the flow or detaching it. The second surprise was that the notch was still there. I was not expecting it, so I did not take points one kt appart near the notch. Also, for some reason, I omitted the 55 kt point that would have helped define the shape of the curve in that region. Therefore, I simply connected the points in the region with a dotted line. Nevertheless, it is clear that the notch is still there and occurs precisely at the speed measured on 1/15/2011, shifted slightly to the right because the glider is now flying about 35 pounds lighter than before. After some thought, I decided that, as unlikely as it seems, the continued presence of the notch indicated that the flow was detaching precisely at the nose of the wing for all positive angles of attack. To verify this, I decided to move the forward edge of the tape down below any point where the relative wind could see it as a step down. I chose 45 degrees below the leading edge and chose to use 12mm wide Test 4104 tape because it had the right thickness...about .003" (76um). Figure 17a below shows the results of this change. It performed exactly as anticipated. The severe loss at positive AOAs was replaced with a nice improvement of approximately 15% and the notch disappeared. This is the first time something has turned out exactly as I expected, with no surprises. And it is the first truly practical outcome!
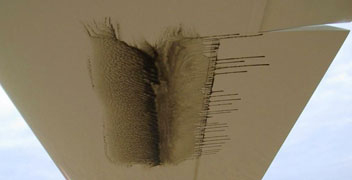
Oil-Flow Evidence
The difference in these images is immediately obvious. The deturbulator strip in Figure 19 is located behind the normal transition bubble that is so obvious in Figure 18. Click on Figure 19 to expand it and you will see that in the normal transition bubble region the oil has been smoothed, indicating gentle reverse flow. Ahead of that region, a stagnant pattern indicates a broad region of detached flow without the usual streaming from air flow on or very near the surface. The end of thick runs near the leading edge witness significant early detachment, well beyond normal. Behind the deturbulator panel, again thick oil runs end within two inches of the panel, again indicating detached flow that can no longer force the oil into streams. Normally, this region has thick oil streams that indicate attached turbulent flow. These images indicate (1) greater detachment from the surface of the bubble, (2) a flattened bubble with reduced circulation flow and (3) detached flow behind the deturbulator strip. It appears that the boundary flow approaches the deturbulator at a grazing angle and then skips off of it to produce detached trailing flow. Figures 20 and 21 show normal and deturbulated oil visualizations of bottom surface boundary flows. Since there is no deturbulator panel on the bottom surface, it appears that the back-facing step presented by the leading edge tape is enough to prematurely detach the flow, flatten the bubble and reattach the flow gently at a grazing angle so as to produce less turbulence in the trailing edge flow.
Tape Properties
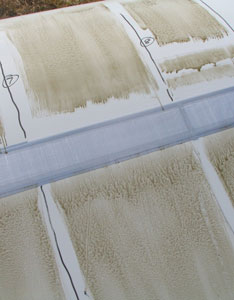
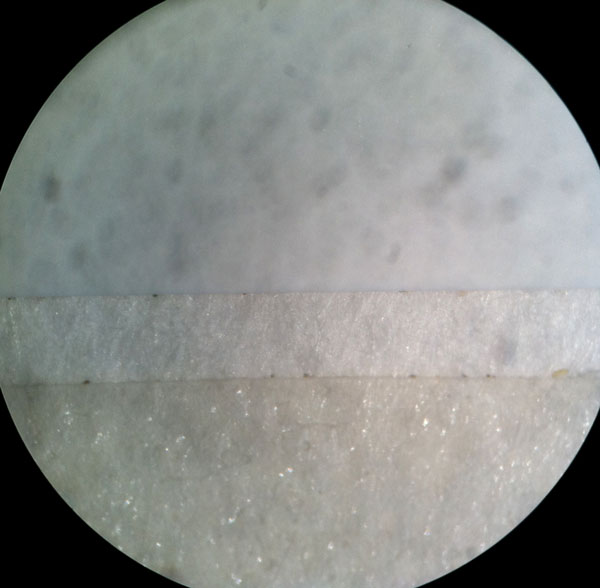 Figure 24. Surface texture of Transparant (bottom) and White (top) Tesa 4104 Tape (Transparant overlaps White in the middle) This is enough reason to suspect that such a difference could have affected the IDAFLIEG result. This is not known, it is just a fact that the tape they used had a noticeably more textured surface. Considering the thinness of the tape compared to the scale of the textures on the surface, it is reasonable that any positive effect from the step-down at the rear of the tape could be destroyed by purturbations in the flow from the textured surface. I should point out that I mistakenly sent the wrong tape to the IDAFLIEG people. Their work was excelent and of the highest quality.
Hyvärinen Project |
